
Tuva can show the same dataset as a table, as a single-case card, and as a dozen kinds of chart. This page is a map of them: what each one is for, and a link to a hands-on lesson in Tuva’s own tutorial course.
If the words attribute, case or case card are new, start with Tuva vocabulary or Getting to know the Tuva interface.
Every chart below is built from the toolbar across the top of the tools.
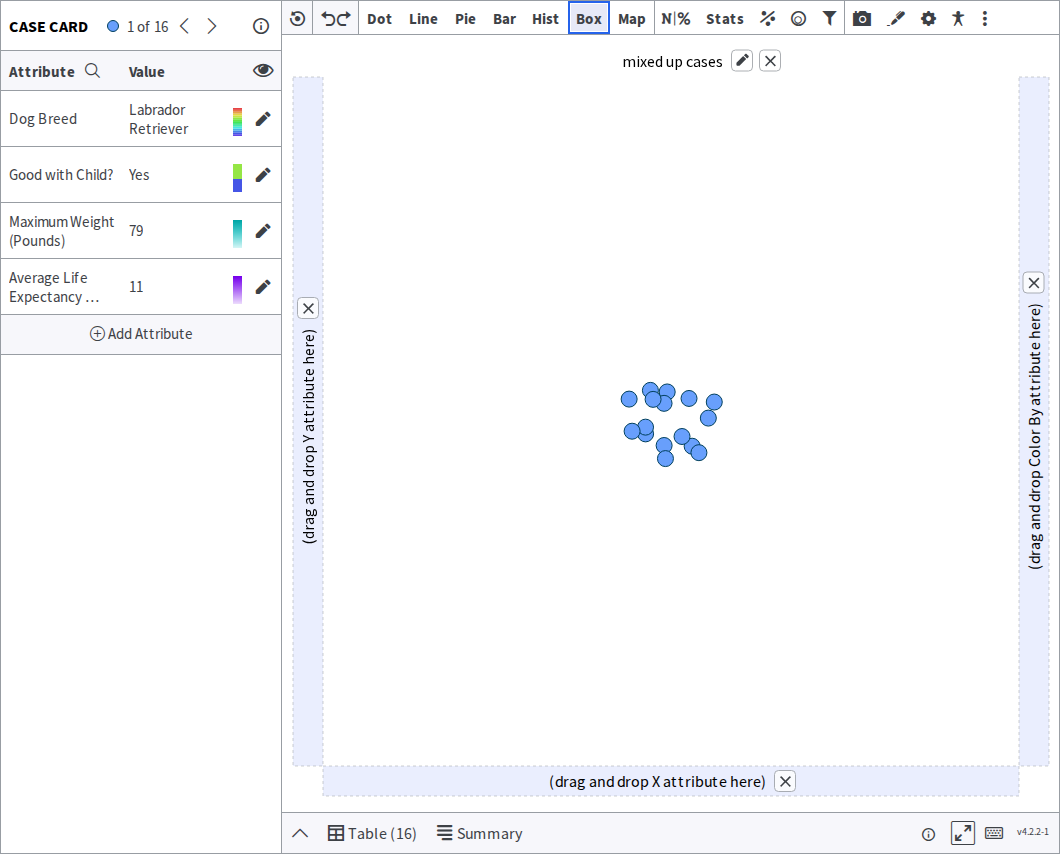
Two ways to read your data
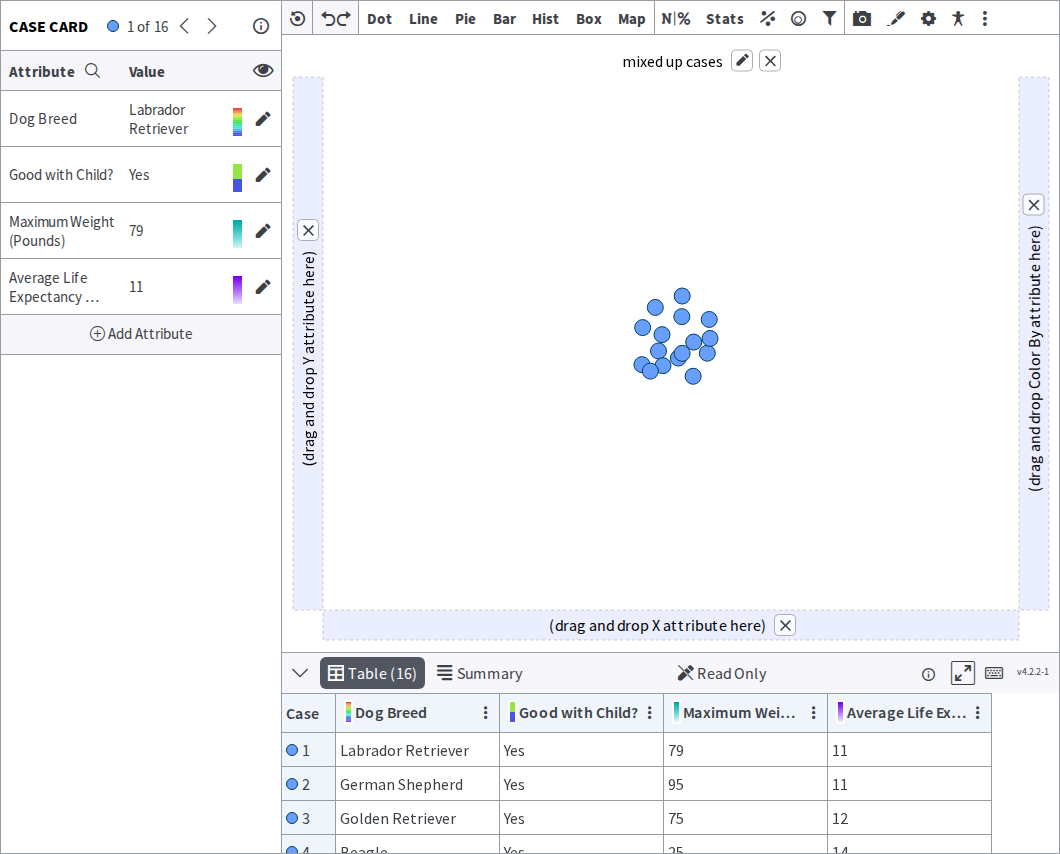
Section titled “Two ways to read your data”Before any chart, Tuva shows the same data two ways: the Table View as rows and columns, and the case card as one case at a time with all its attributes. Work through it
Showing the shape of one attribute
Section titled “Showing the shape of one attribute”Use these when the question is how are the values spread out?
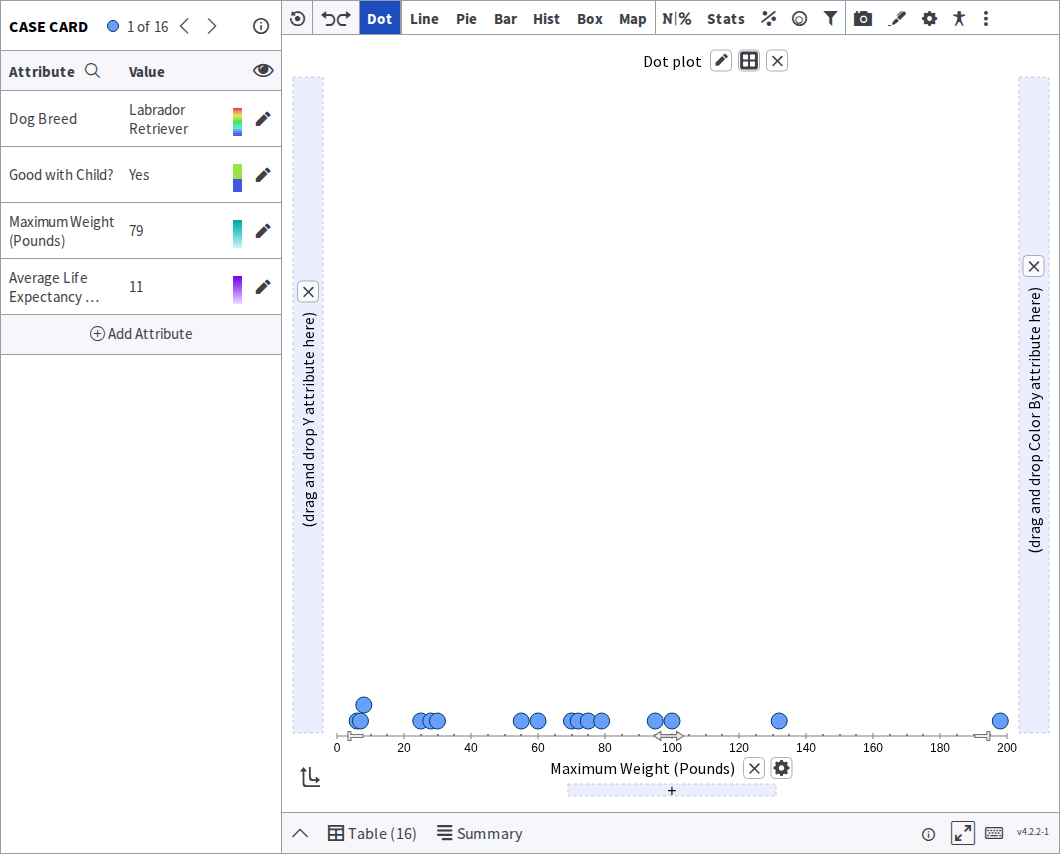
Dot plot — one dot per case, stacked where values repeat. The best first look at a numerical attribute, because no detail is hidden. Work through it
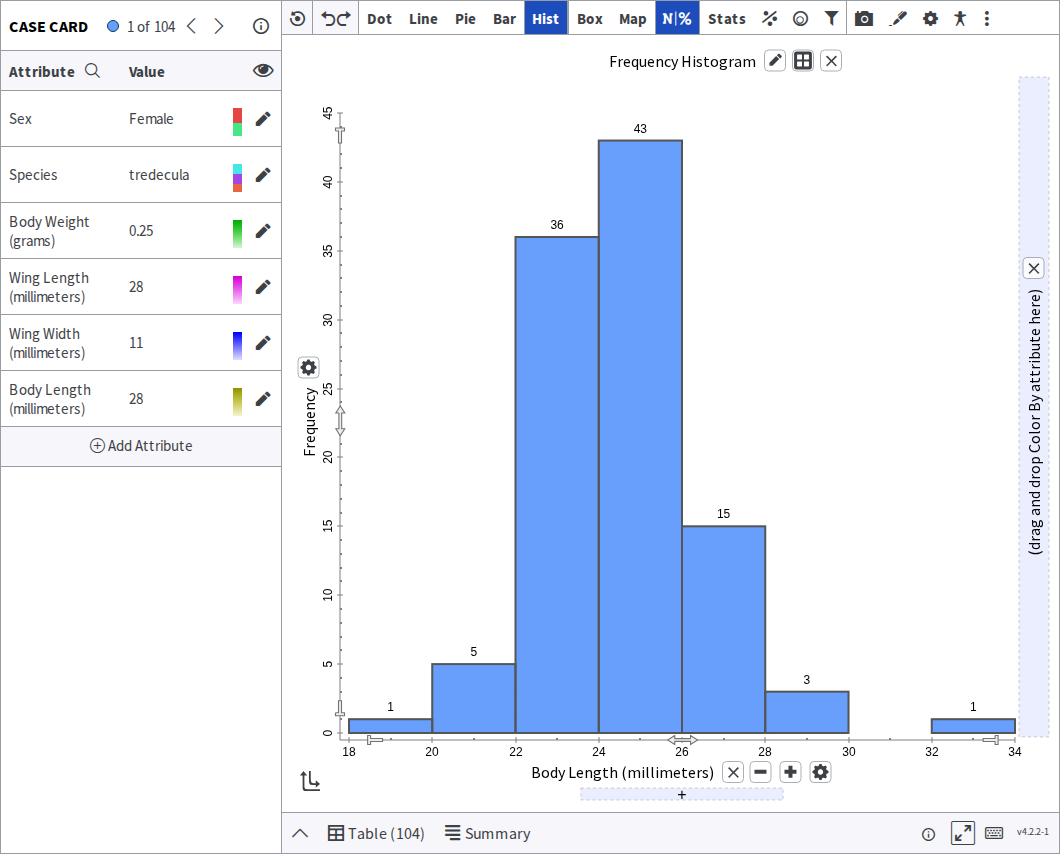
Histogram — values grouped into bins and drawn as bars. Better than a dot plot once you have too many cases to see individual dots. Work through it
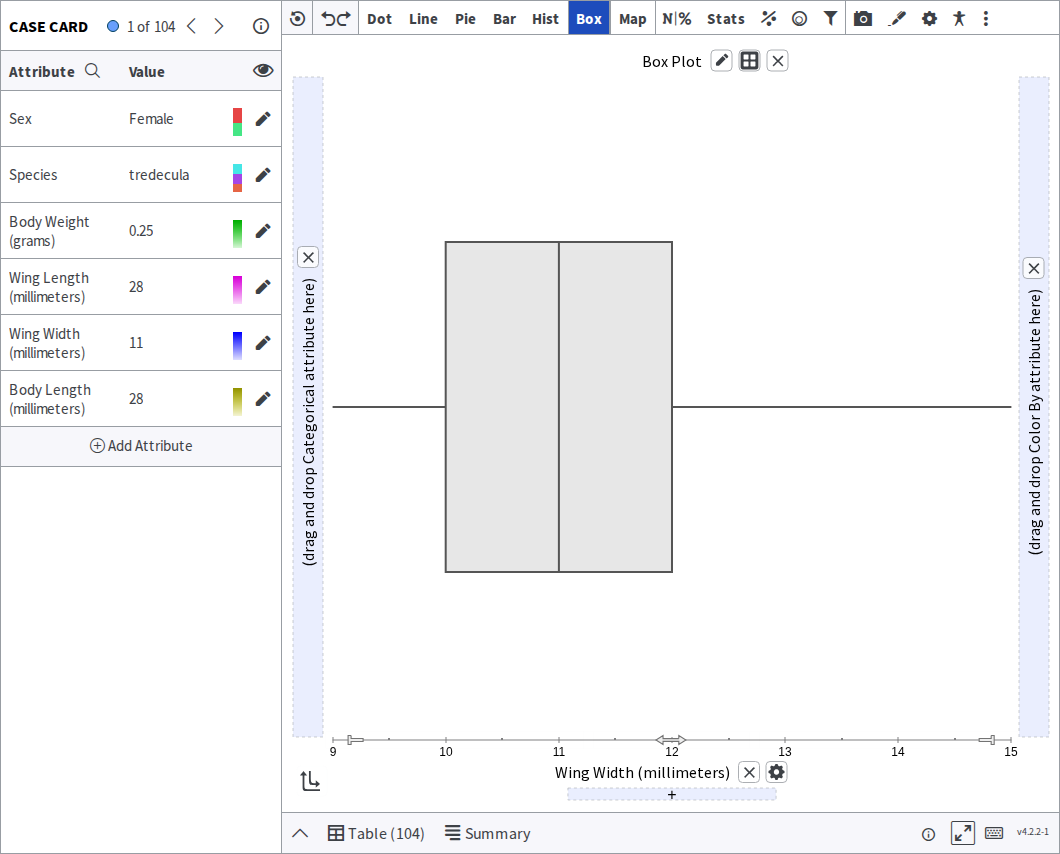
Box plot — the median, the middle half of the data, and the outliers. Compact, and built for comparing several groups side by side. Work through it · How Tuva computes the quartiles
Comparing groups or categories
Section titled “Comparing groups or categories”Use these when the question is how do these categories differ?
Bar chart of frequencies or values — how many cases fall in each category, or the value recorded for each. Work through it
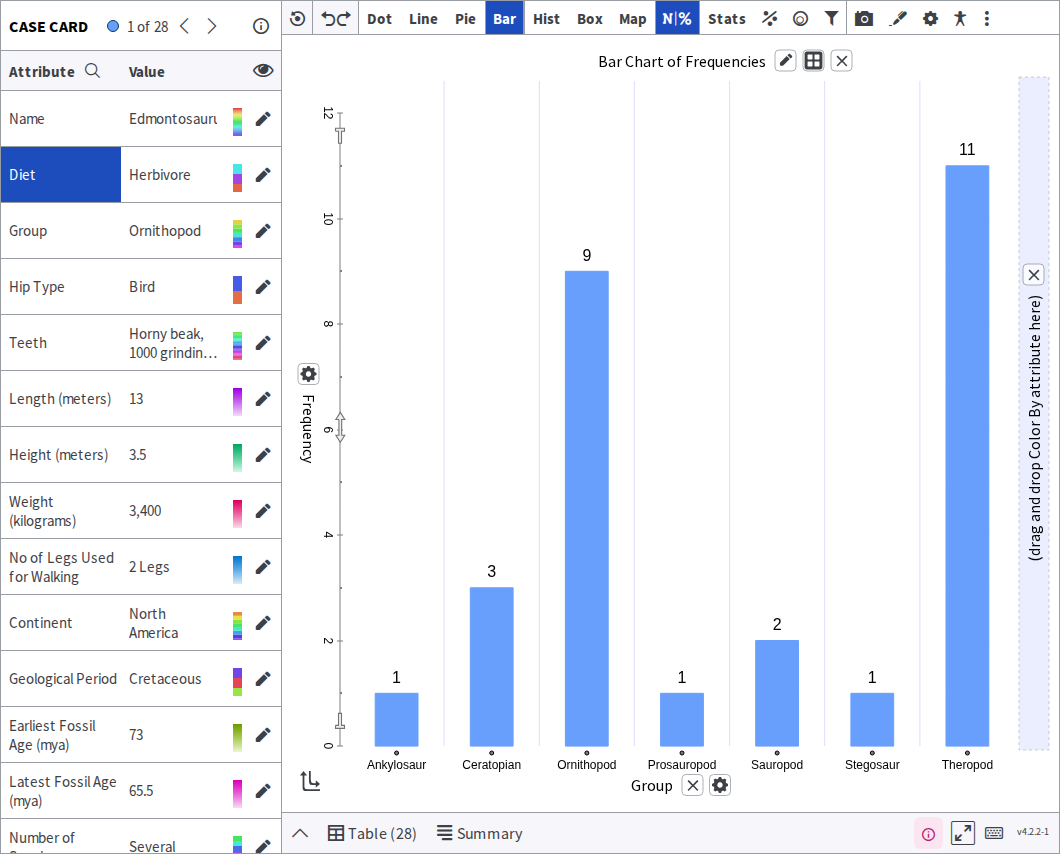
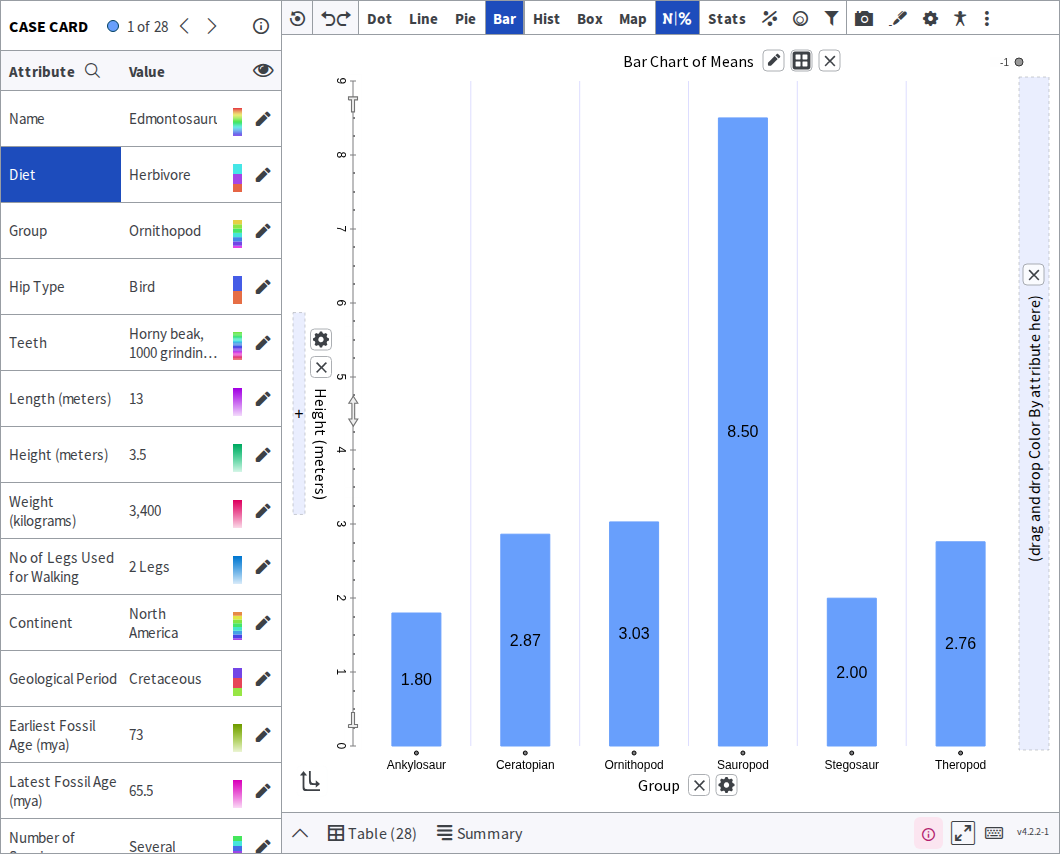
Bar chart of sums or means — the total or the average per category, rather than a count. Work through it
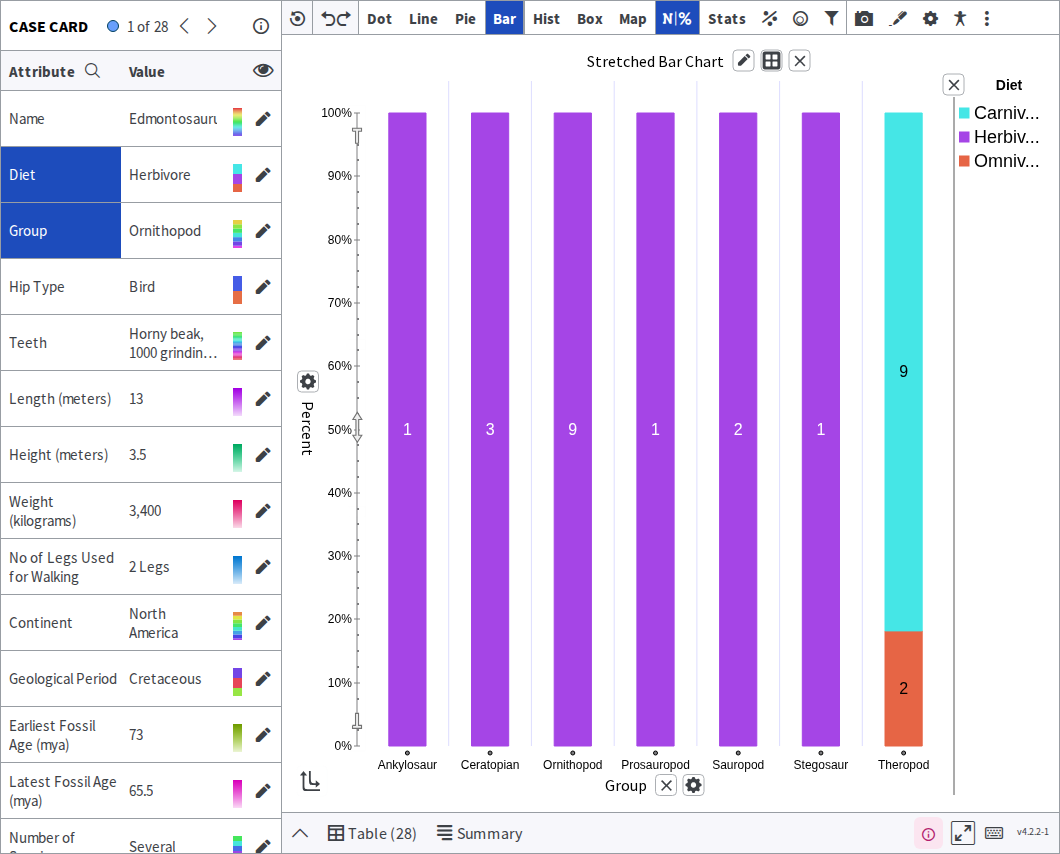
Stretched bar chart — each bar filled to the same height, so you compare proportions rather than totals. Work through it
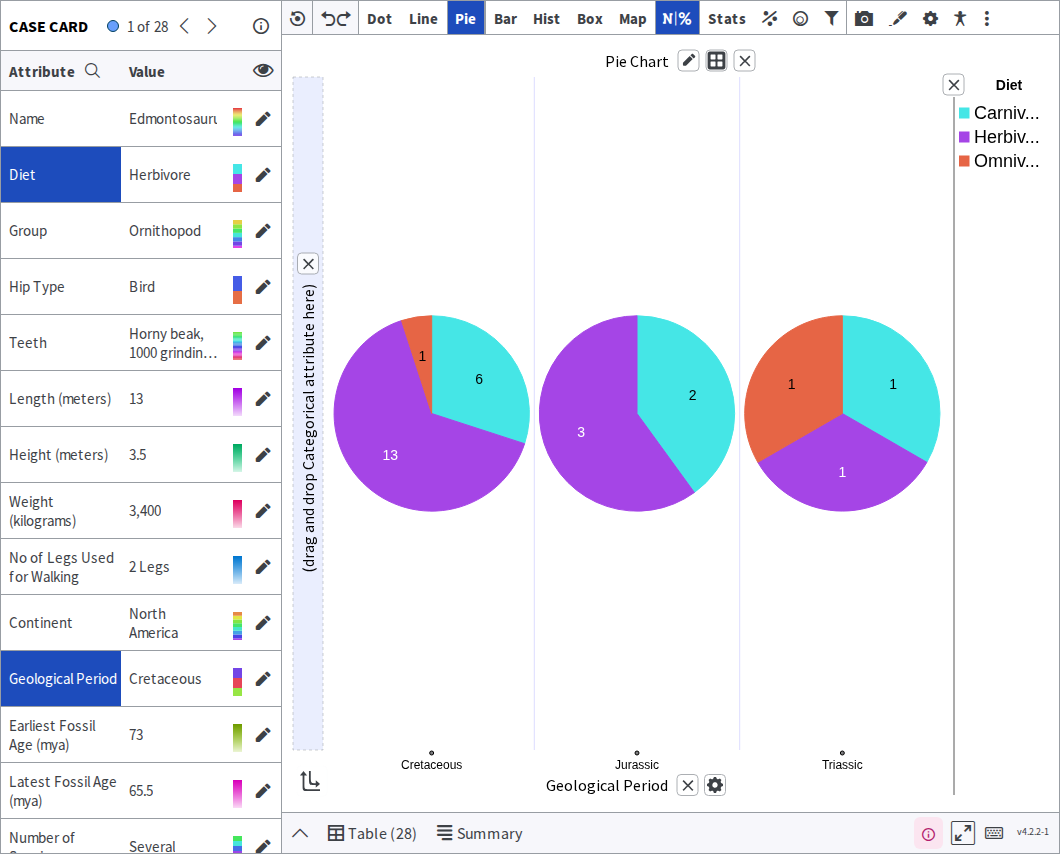
Pie graph — parts of one whole. Hard to read precisely, so prefer a bar chart when the differences are small. Work through it
Relating two attributes
Section titled “Relating two attributes”Use these when the question is does one thing change with another?
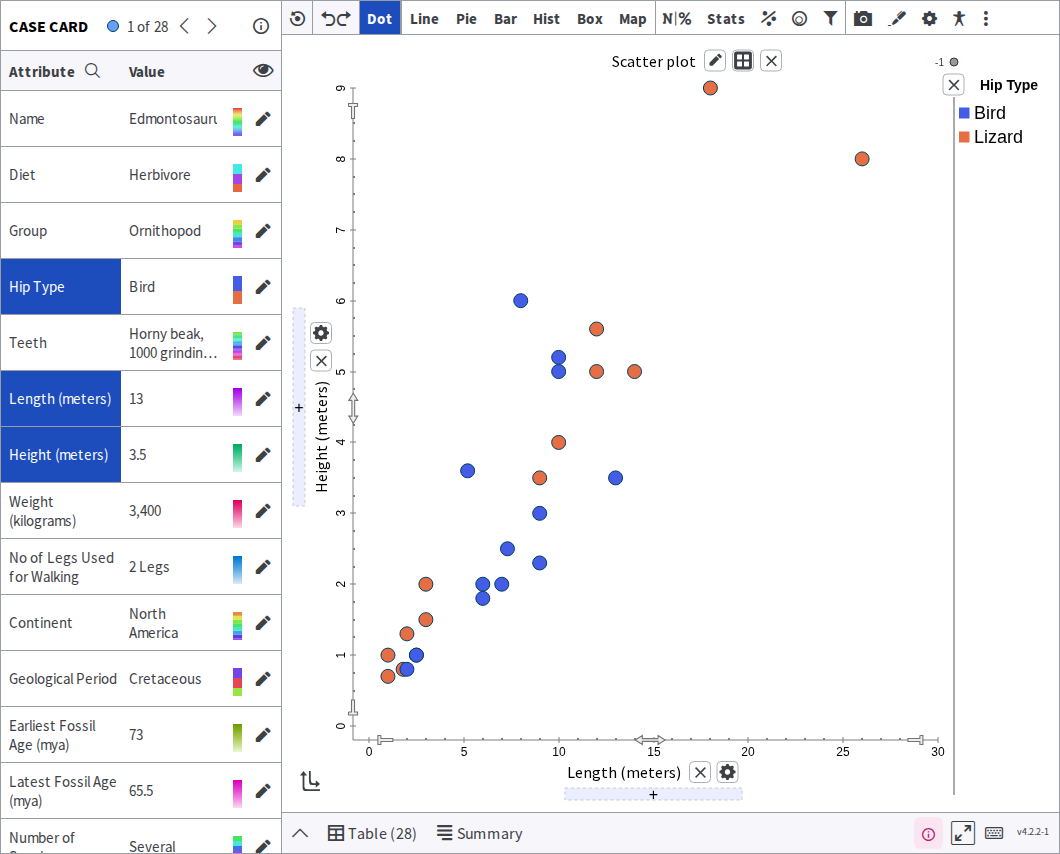
Scatter plot — one point per case, positioned by two numerical attributes. The starting point for any question about a relationship. Work through it · then fit a line to it
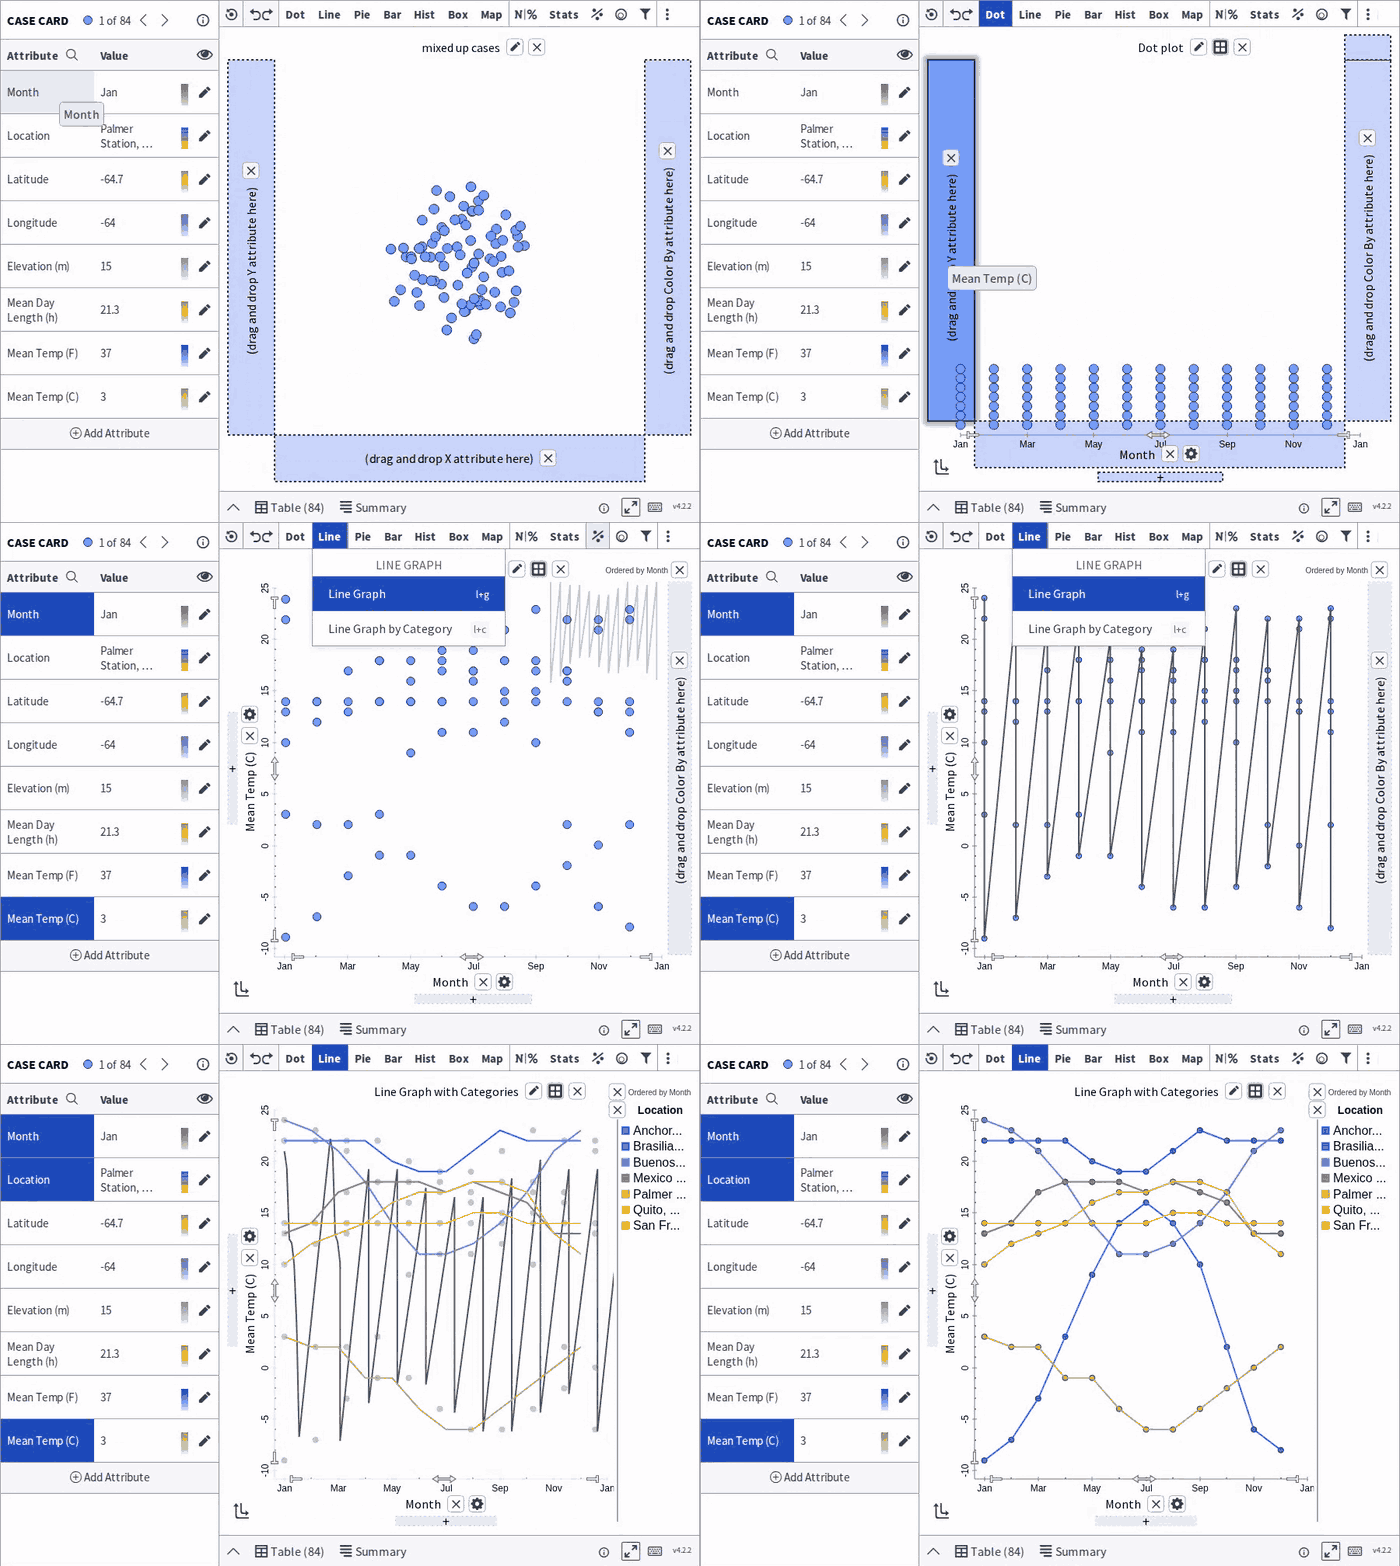
Line graph — values joined in order, usually over time. Work through it
Putting data on a map
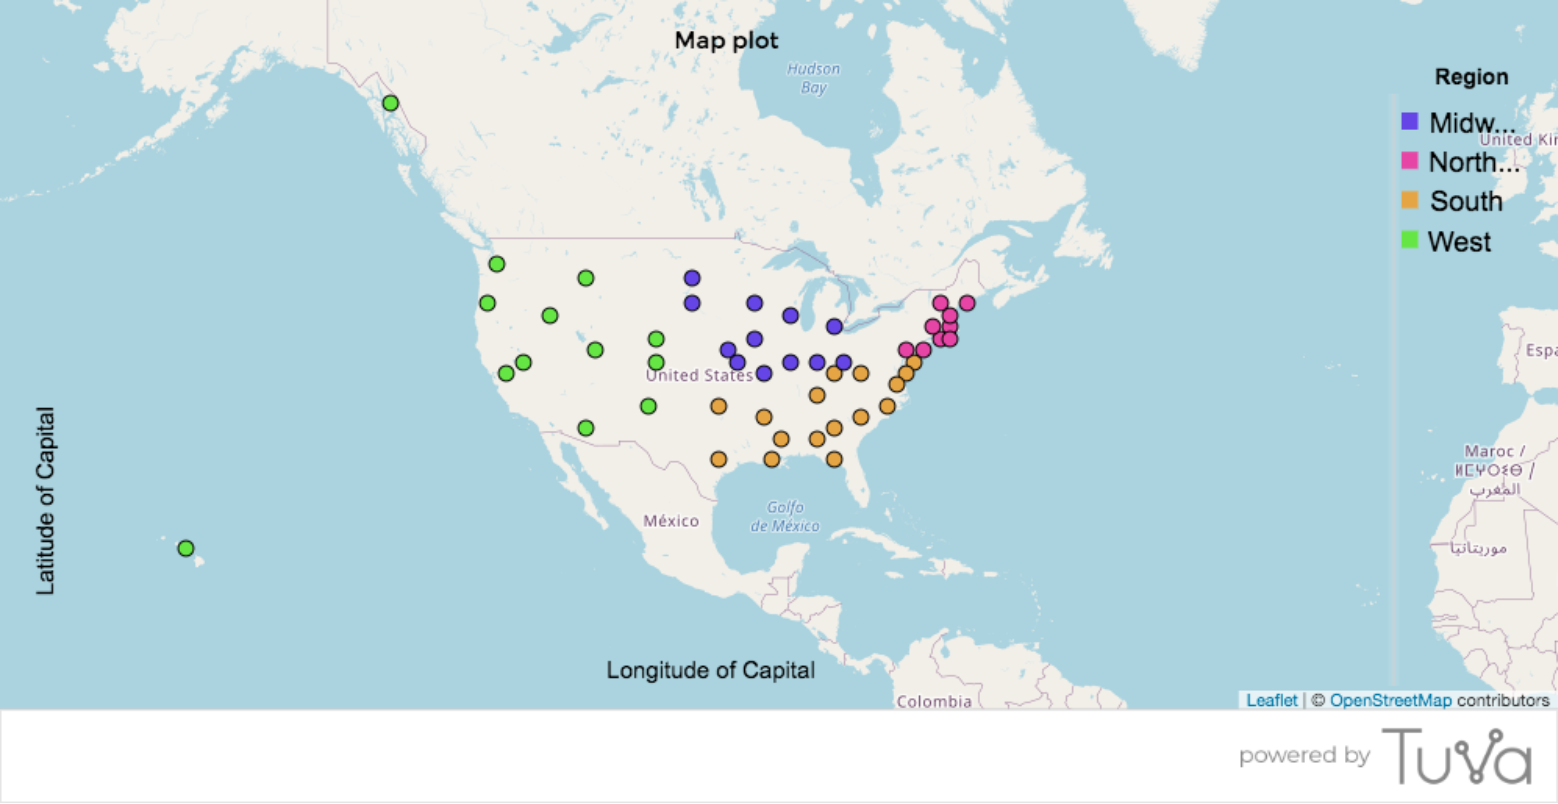
Section titled “Putting data on a map”Map — cases plotted by location, when your data carries somewhere to plot. Work through it
Was this page helpful?
This opens the ticket form with your comment and a link to this page, so we can reply to you.
Submit a ticket