
Tuva enables users to customize the display. Flexible options for how information is displayed enhance clarity for various learners and accommodate the preferences of others. Users can adjust settings for the following:
- data color
- color contrast
- font and case sizes
Data Color Settings
Section titled “Data Color Settings”Customizable color settings in Tuva tools enable individuals with colorblindness to distinguish and interpret data. This feature modifies the colors assigned to individual data points to make them colorblind safe or grayscale.
To customize data colors, follow the step-by-step instructions below:
1. Click the accessibility button in the toolbar to open the Accessibility Card.
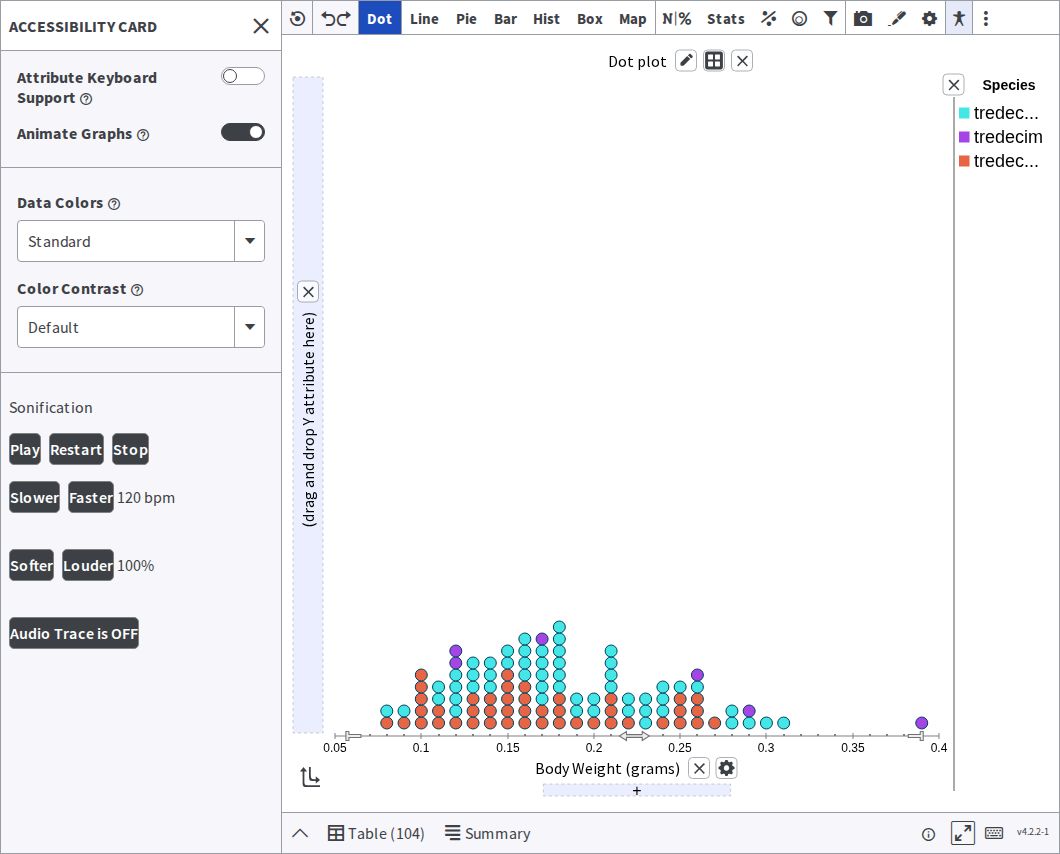
2. Within the Accessibility Card, locate the Data Colors dropdown menu. Click on it to reveal the list of available data colors.
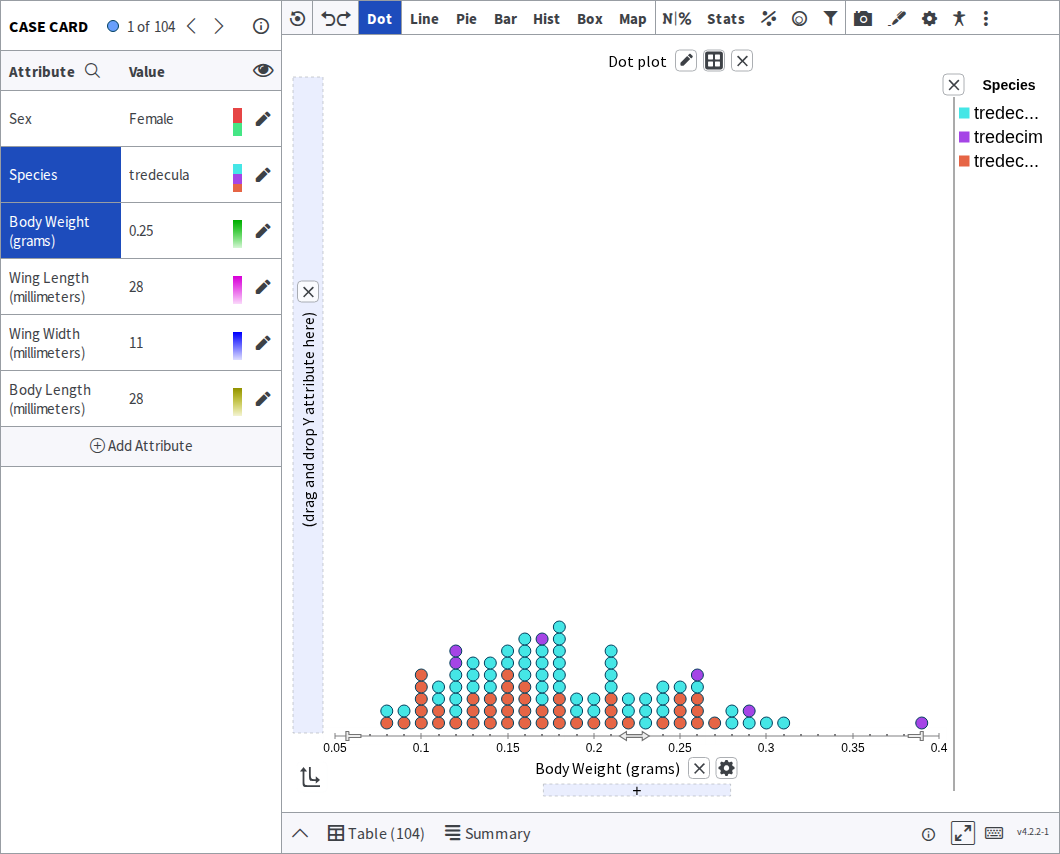
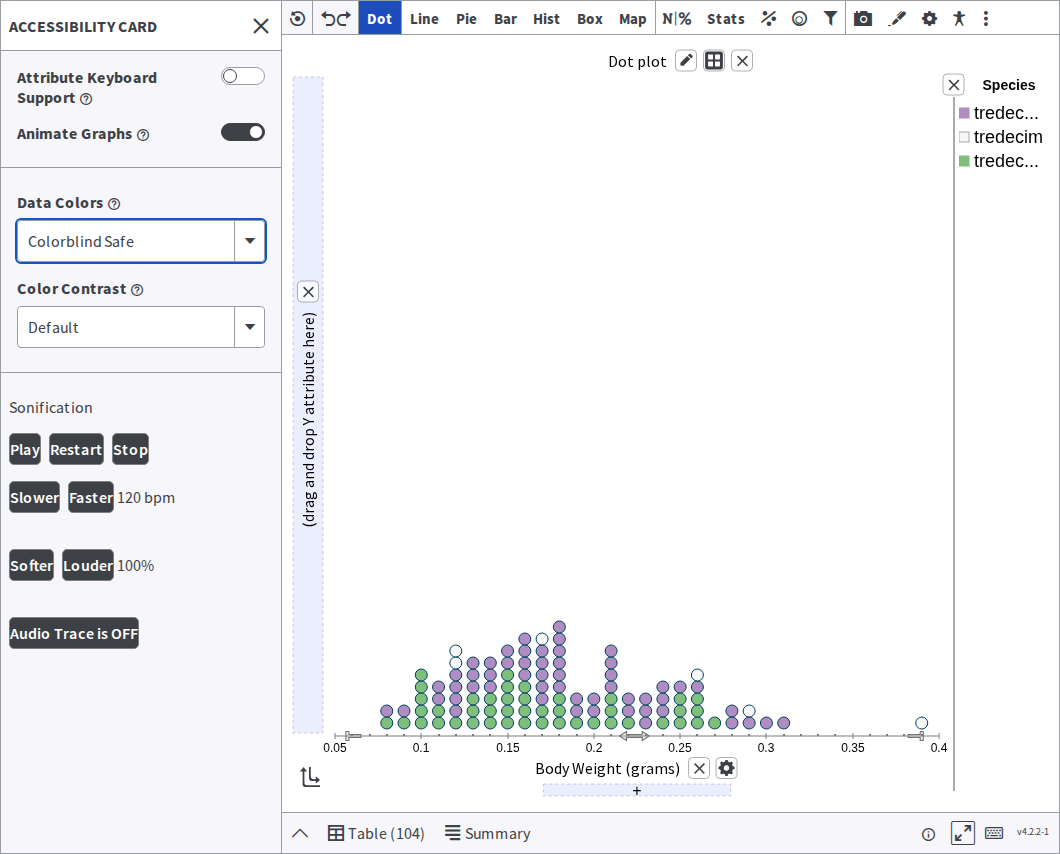
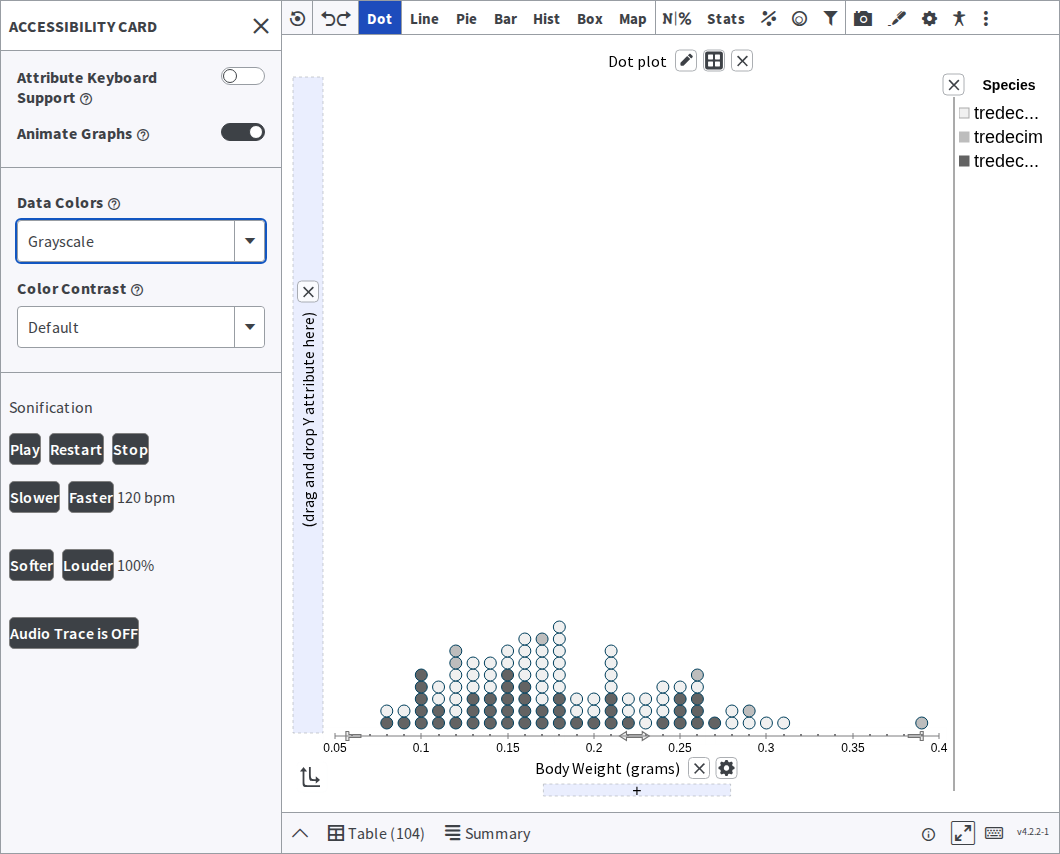
3. Select one of the options provided, such as Colorblind Safe or Grayscale. By choosing a specific data color option, the colors of categorical and numerical attributes will be updated accordingly. If an attribute is already applied to the cases in the plot, you will see those colors update as well.
The Tuva Tools offer three data color options. Standard is the default:
Colorblind Safe redraws the same plot in a palette that stays distinguishable:
Grayscale drops colour altogether:
Color Contrast Settings
Section titled “Color Contrast Settings”By adjusting the color contrast, individuals with low visual acuity can enhance the visibility and legibility of on-screen information, facilitating a more accessible and comfortable data analysis experience. This feature adjusts contrast by modifying the foreground, background, and text colors.
To change the color contrast setting, follow the step-by-step instructions below:
1. Click the Accessibility button.
2. In the Accessibility Card, locate the Color Contrast dropdown menu. Click on it to reveal the available color contrast options.
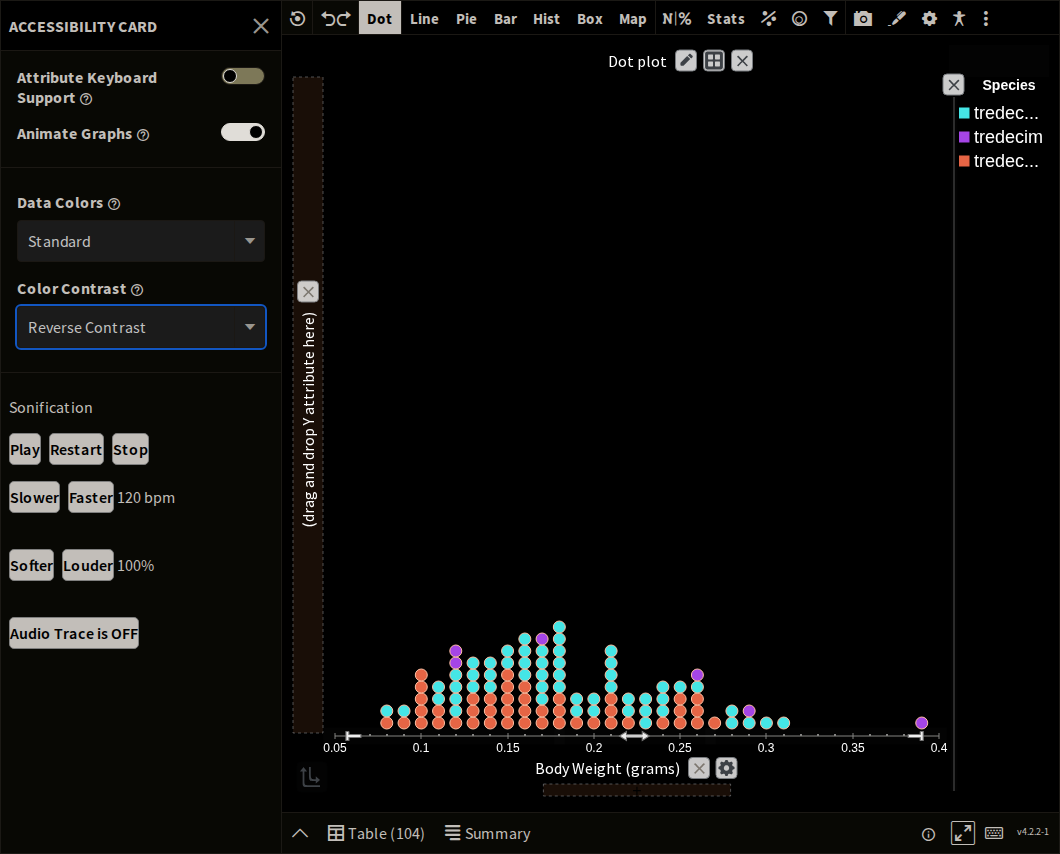
3. Select one of the options. Default is the light screen shown in the screenshots above. Reverse Contrast inverts it — a dark background with the plot drawn light over it:
Font and Case Size Settings
Section titled “Font and Case Size Settings”Ensuring that learners with low visual acuity can easily perceive graphical information is a top priority for us. With that in mind, we have introduced a convenient feature that enables you to adjust both the font size and case size.
To learn how to increase the font and case size, follow the step-by-step instructions below:
1. Open the Plot Settings Card: Access the Plot Settings Card through the toolbar.
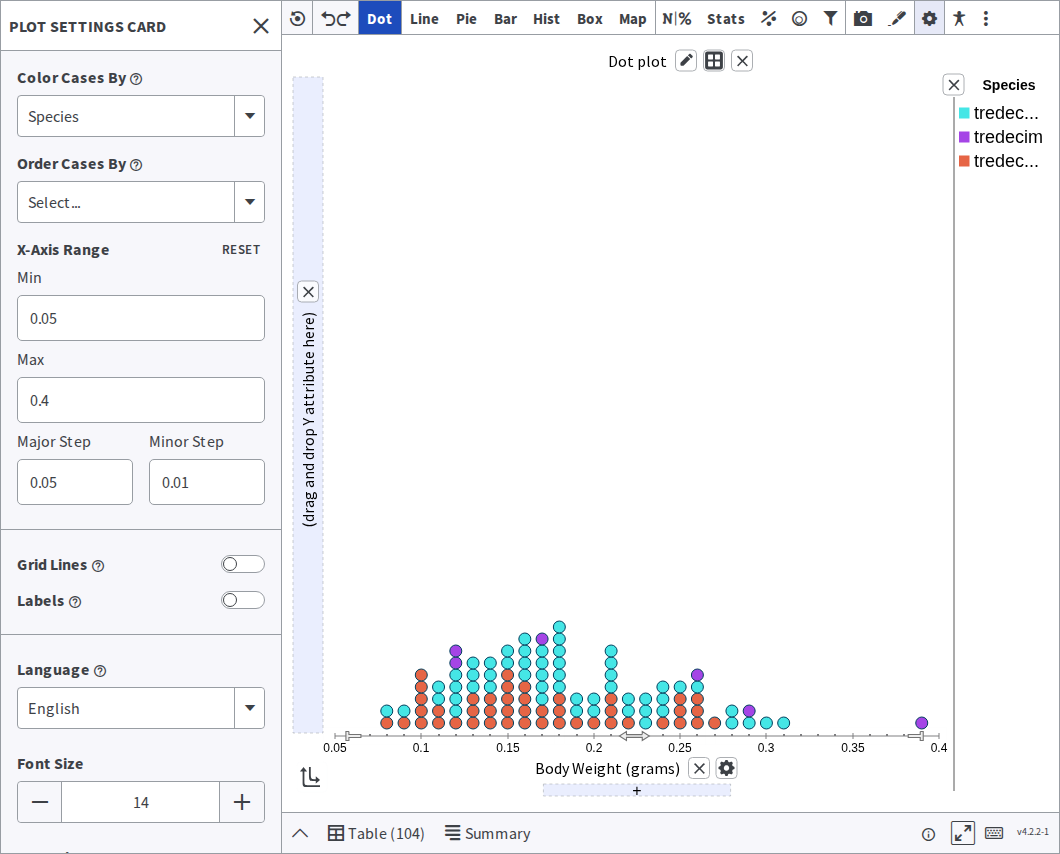
2. Adjust Font Size: Within the Plot Settings Card, locate the controls for adjusting font size. They can be found at the bottom of the card. Clicking on the ”+” button for font size will increase the size of all text displayed in the plotting area.
3. Modify Case Size: Similarly, within the Plot Settings Card, you’ll find controls for adjusting the case size. Click on the ”+” button for case size to increase the size of all circles drawn in the plotting area.
Was this page helpful?
This opens the ticket form with your comment and a link to this page, so we can reply to you.
Submit a ticket