
Claim-Evidence-Reasoning (CER) data stories prompt students to interpret a graph in terms of a written claim, and then explain how specific features of the graph led them to make their claim, or how it supports a provided claim.
Goal: Prompt students to state a claim, and explain how features of a graph support the claim.
Example 1: Tuva Data Story Adaptation to Environmental Change
Two box plots show the distribution of measurements of beak depth (how big the beak is) for finches before and after a year of drought in the Galapagos Islands. Students are given the following prompts:
|
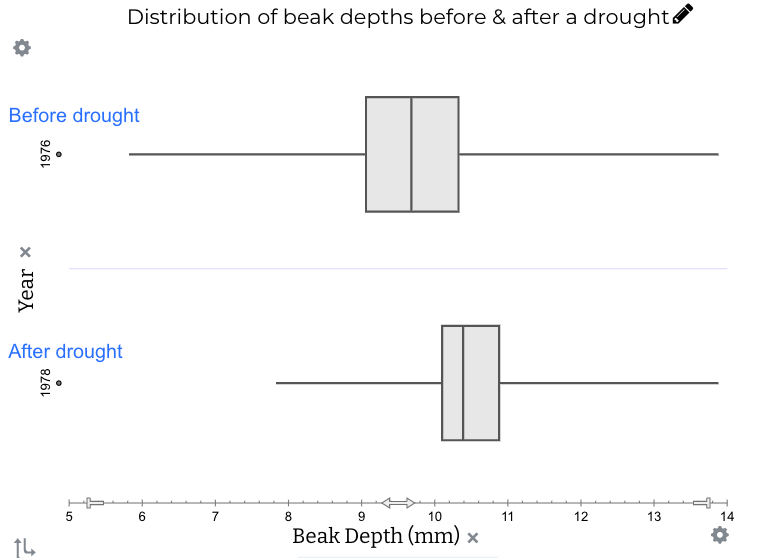
Implementation ideas: Assign Claim, Evidence, Reasoning data stories as straightforward practice for making (or evaluating) claims, linking them to specific features of a graph, and connecting the claim to wider meaning or implications.
Related resources:
McNeill, K., & Krajcik, J., 2012. Supporting Students in Constructing Explanations in Science: The Claim, Evidence, and Reasoning Framework for Talk and Writing. Pearson.
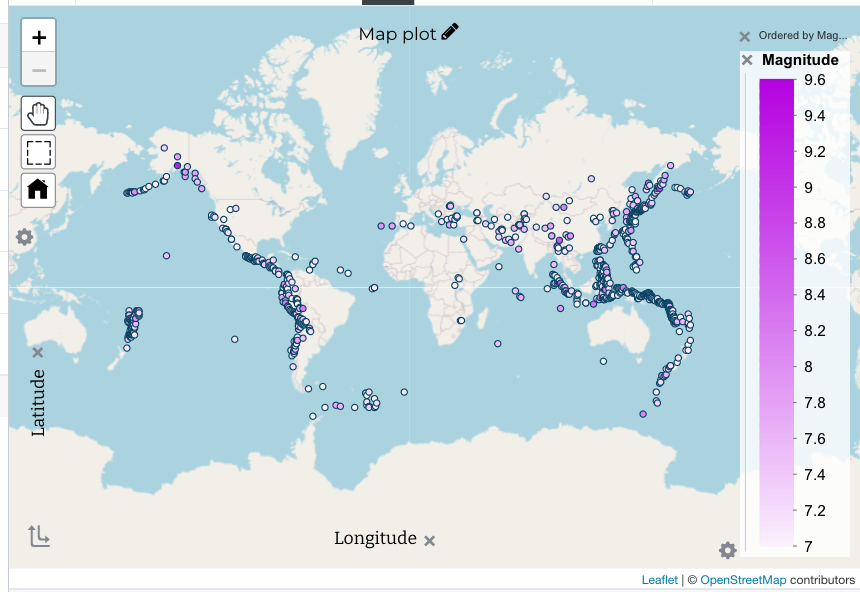
Example 2: Tuva Data Story Where do Earthquakes and Volcanoes Occur? Students review two maps for earthquake and volcano locations and are given a claim to evaluate, based on evidence in the maps.
|
The framework
Section titled “The framework”Claim-Evidence-Reasoning supports students in constructing scientific explanations of what they understand (McNeill & Martin, 2010). Data is the currency of science, so it is the linchpin of all three parts:
- Claim — what you understand, or found, as you explored. A statement that answers the question.
- Evidence — the specific features of the data that support the claim.
- Reasoning — why that evidence supports that claim, and not another.
Was this page helpful?
This opens the ticket form with your comment and a link to this page, so we can reply to you.
Submit a ticket