
Tuva can draw random samples from a dataset — small groups of cases picked at random — so students can see how much a sample’s average wobbles compared with the full dataset. Whichever dataset you have open plays the role of the population: the complete group you are sampling from.
Put a numerical attribute on an axis
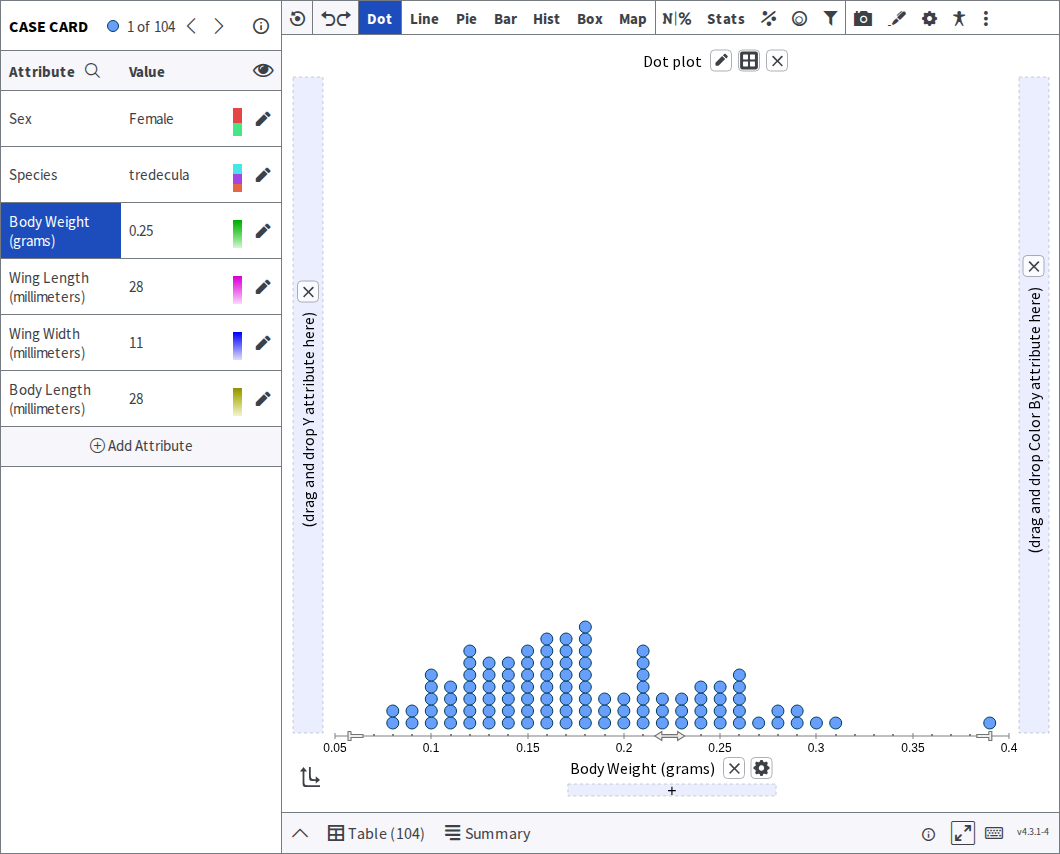
Section titled “Put a numerical attribute on an axis”Sampling works with respect to a number, so a numerical attribute has to be on an axis first. These screenshots use the Cicadas dataset with Body Weight (grams) on the horizontal axis.
Open the sampling card
Section titled “Open the sampling card”Click Sample in the toolbar. The panel is headed SAMPLING CARD.
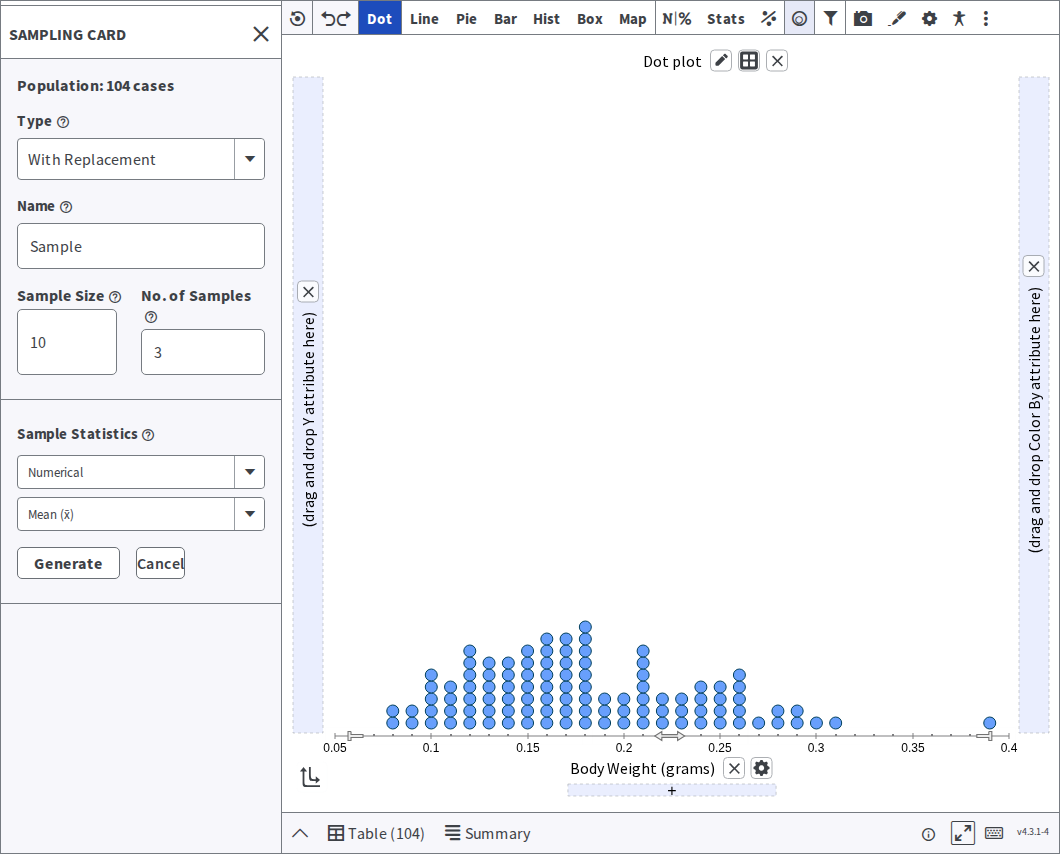
It offers:
- Type — without replacement means each case can be picked at most once, like dealing cards. With replacement means a case can be drawn again, like rolling a die, so the same case may appear twice in one sample. Choose without replacement unless your lesson specifically calls for the other.
- Name — what this sample is called on the plot and in the statistics table.
- Sample Size — how many cases to draw.
- Number of Samples — draw more than one in a go. Anything above 1 is what lets students see variability between samples.
- Sample Statistics — choose which one to compute for each sample. Two dropdowns do this: the first is the kind of attribute (Numerical or Categorical), and the second is the statistic. For a numerical attribute, five are offered: Mean (x̄), Standard Deviation (s), Variance (s²), Median and Interquartile Range. You pick one at a time, before generating.
Generate
Section titled “Generate”Click Generate. (Cancel closes the card without drawing anything.)
What Generate produces
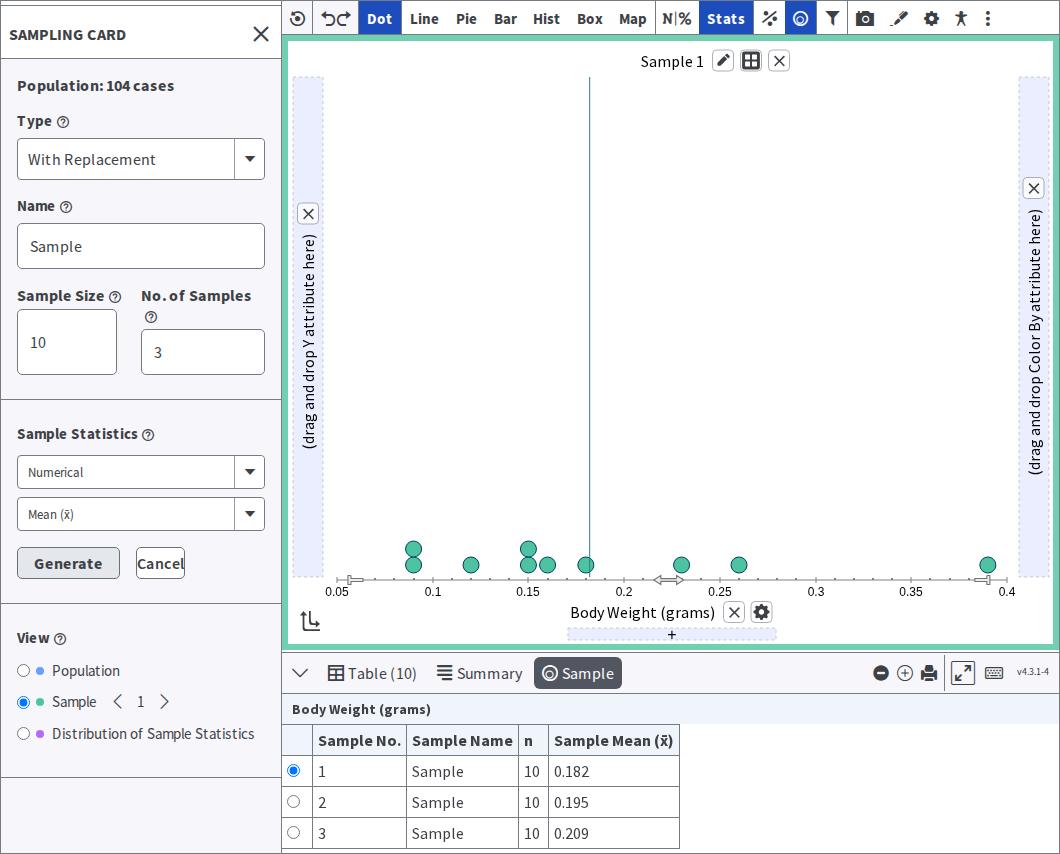
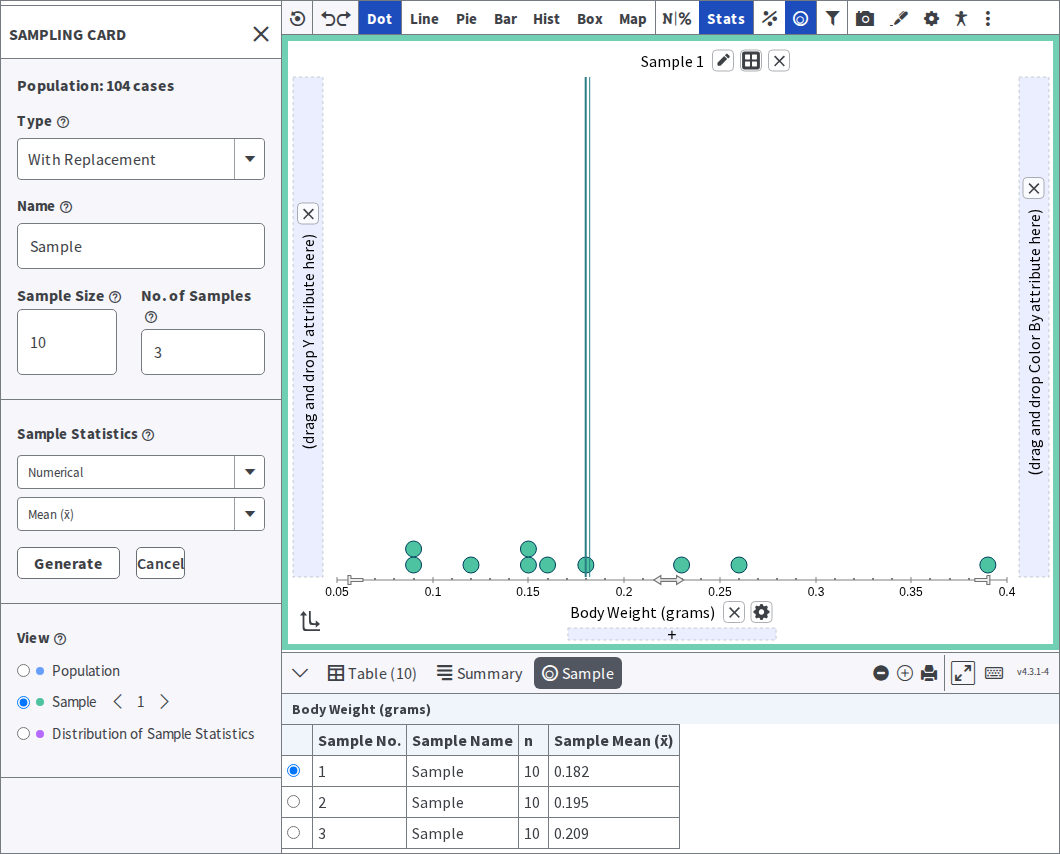
Section titled “What Generate produces”After clicking Generate, a few things will happen. First, the Sample Statistics will appear below the plotting area, which will show you the current sample you’re looking at and also list the values for any statistics you’ve selected. Then, the plot will update to visually show you the cases in your sample and also show any statistics for the specific sample.
You may also expand the Sample Statistics table by clicking and dragging the line separating the plot and the table, so you may view more of the statistics.
Also notice the radio buttons in the left hand column of the Sample Statistics table. Clicking on a radio button will update the plot to show the selected sample.
If you’re interested in plotting the Sample Statistics table as a way to explore the variability between the sample statistics in comparison to the population, you may copy and paste the table into a spreadsheet. Then, reimport the spreadsheet into Tuva to allow you to visualize the variability with the Tuva Tools.
Compare a sample with the whole population
Section titled “Compare a sample with the whole population”Selecting a population parameter will allow you to compare a set of the generated samples to the population. Population parameters are in the Stats menu: Population Mean (μ), Median, Standard Deviation (σ), Variance and Interquartile Range, listed above the matching sample statistics.
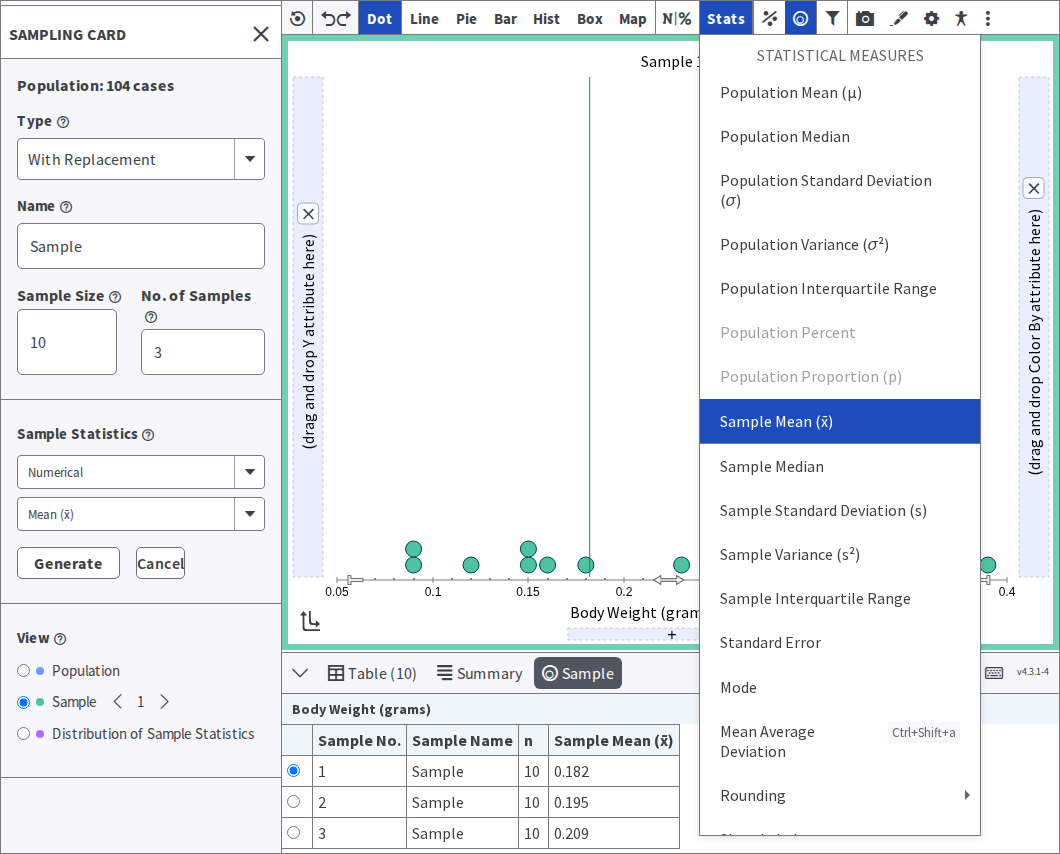
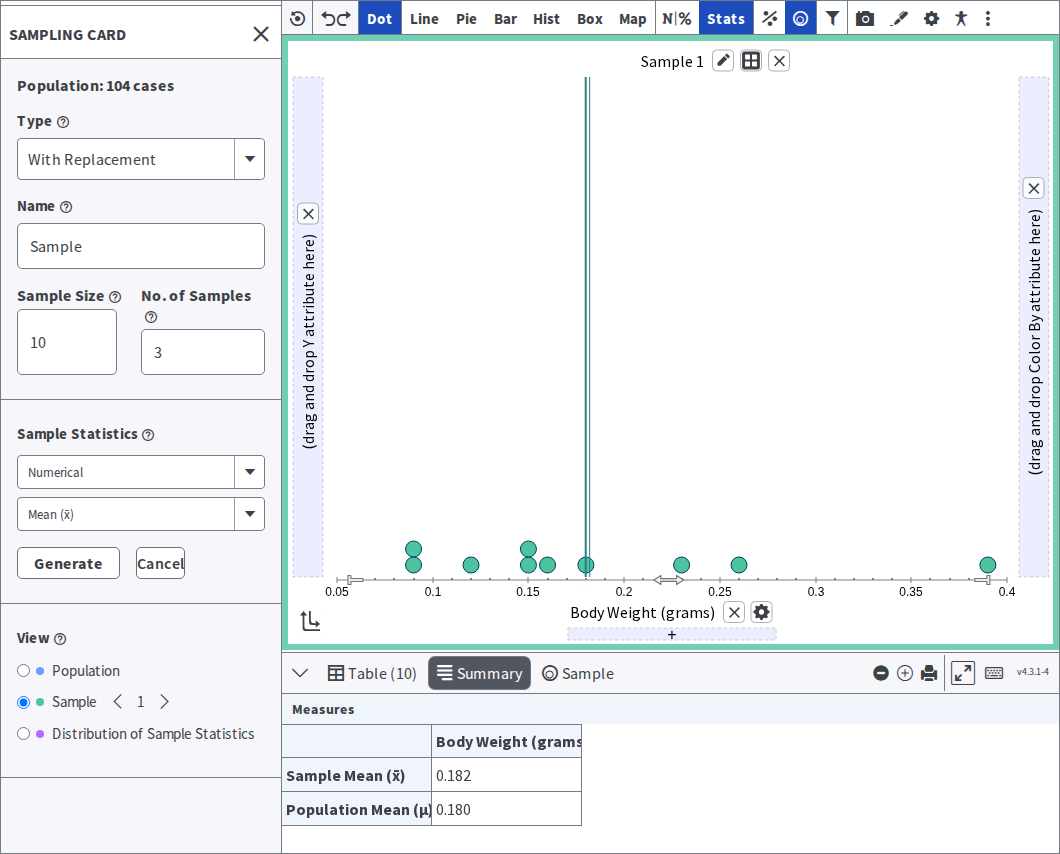
After selecting a population parameter, it is drawn on the plot as its own line. Open the Summary tab below the plot to read it next to the sample statistic.
Was this page helpful?
This opens the ticket form with your comment and a link to this page, so we can reply to you.
Submit a ticket