
Tuva can draw statistical measures onto a plot and list them as a table below it.
-
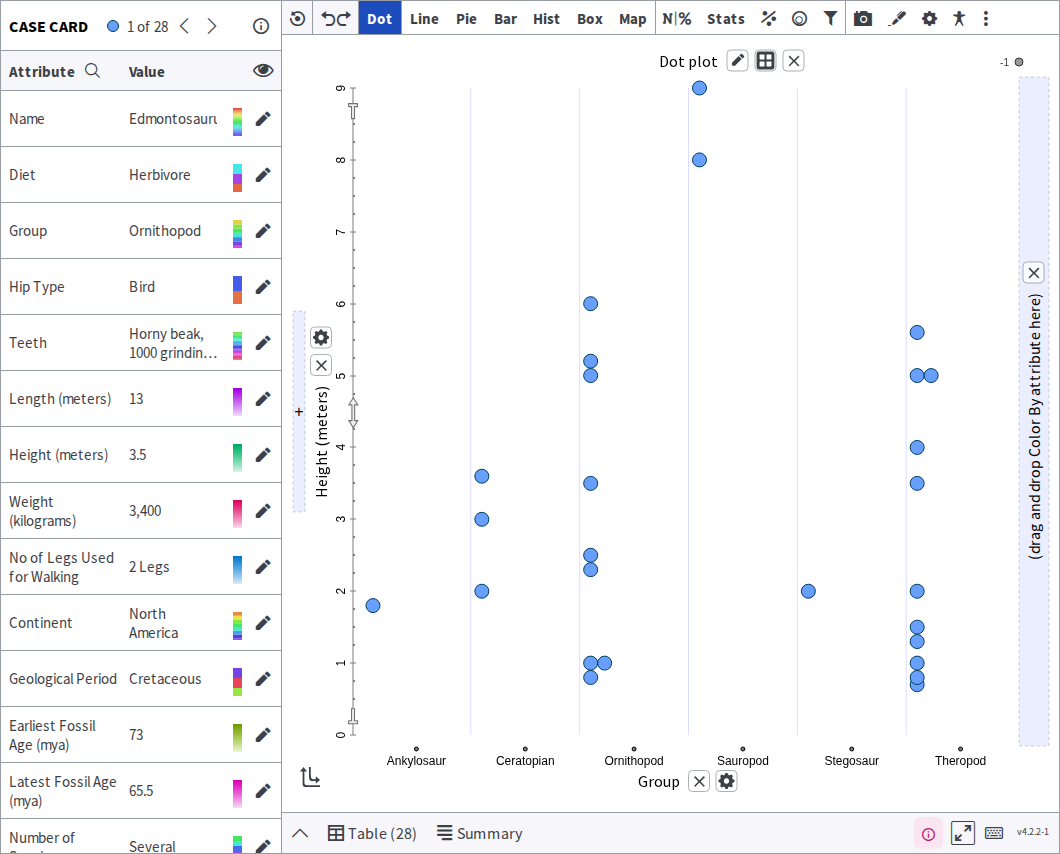
Build the plot you want statistics for.
-
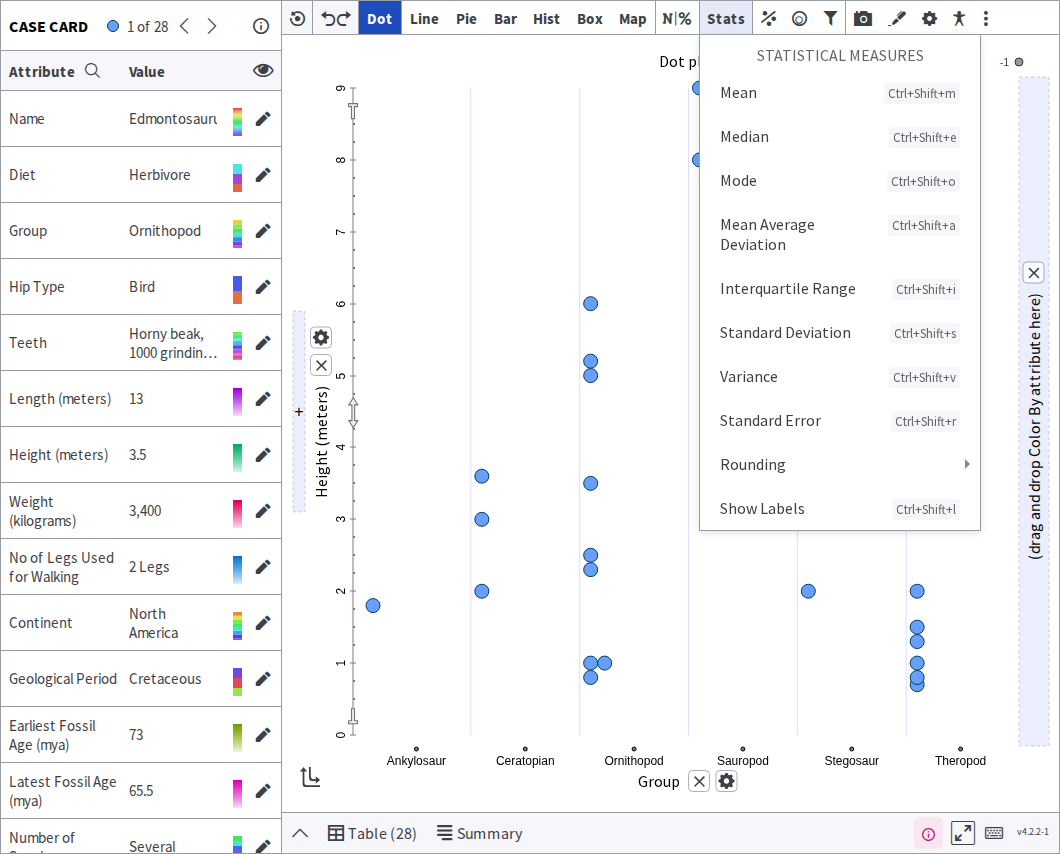
Click Stats in the toolbar across the top. The menu offers Mean, Median, Mode, Mean Average Deviation, Interquartile Range, Standard Deviation, Variance, Standard Error, plus Rounding and Show Labels.
-
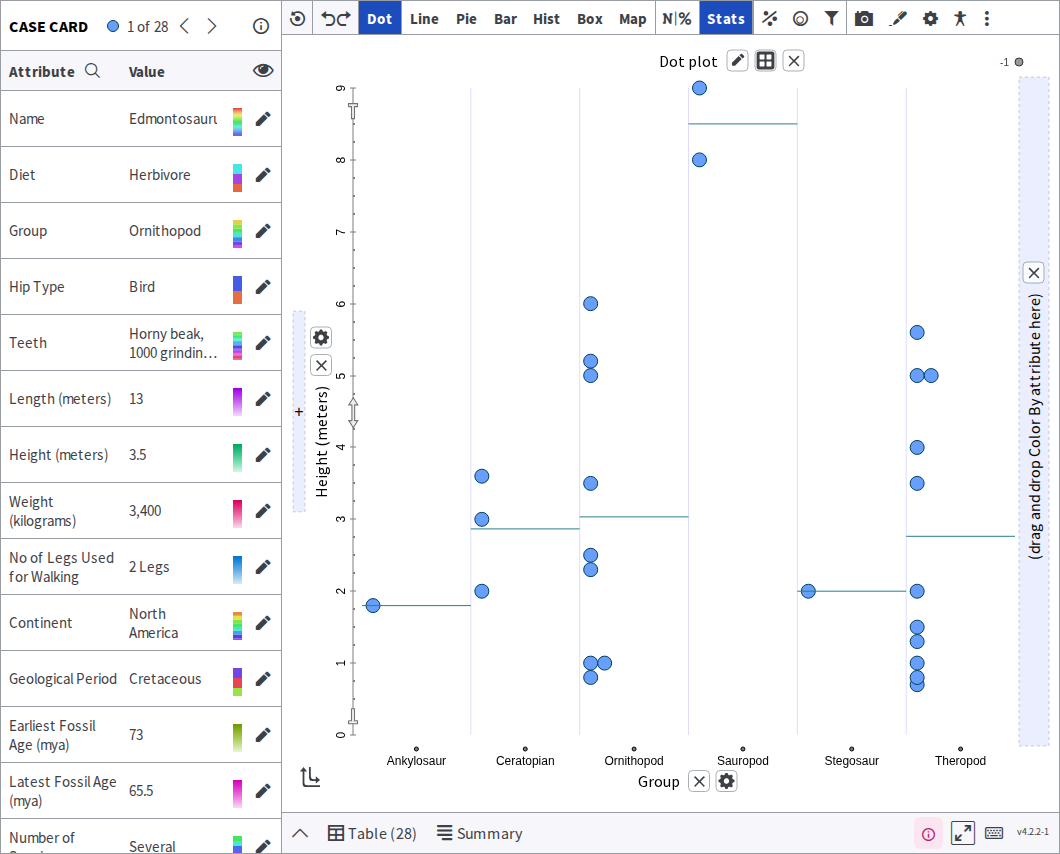
Click a measure to switch it on. A line for it appears on the plot, and you can switch on more than one at a time.
-
Click Summary at the bottom of the screen, next to Table, to see the same measures as a table.
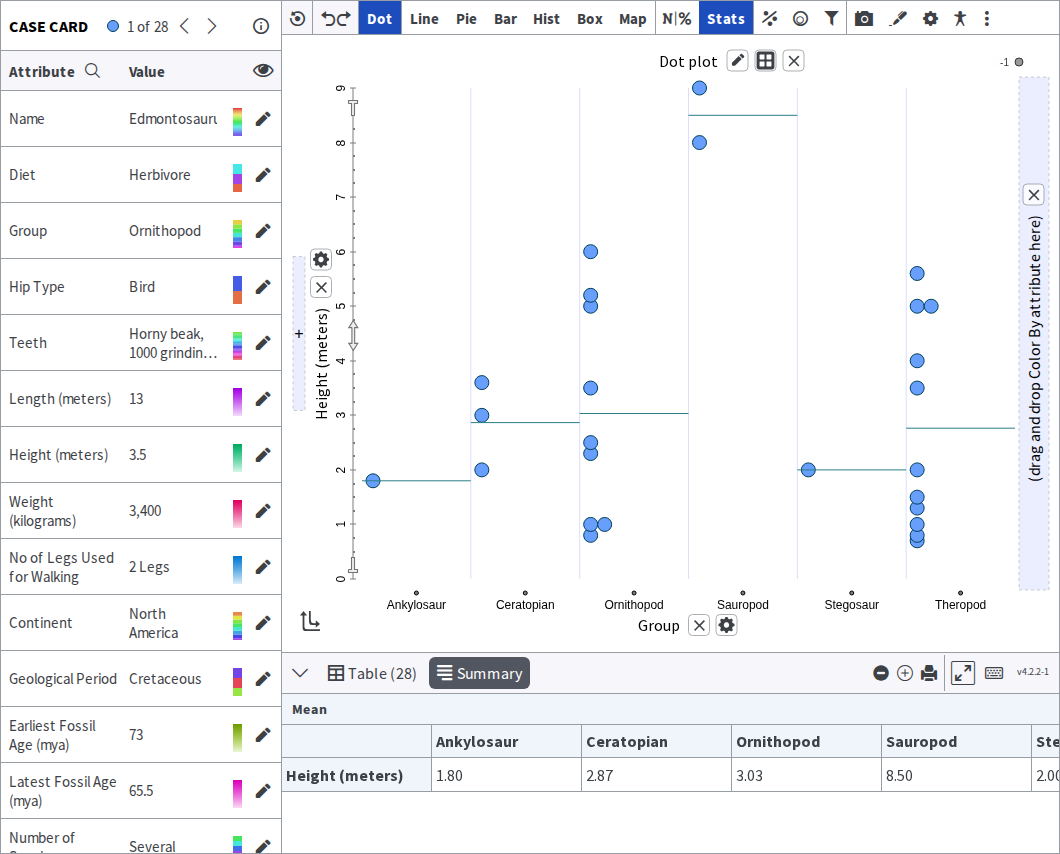
The Summary tab lists one table per measure you have switched on. If a categorical attribute is on an axis, it breaks the measure down by that attribute’s categories rather than giving one figure for the whole plot.
Counts are a separate menu
Section titled “Counts are a separate menu”Count is not in the Stats menu. It lives in Count and Percent, alongside Percent, Proportion and Dividers. Switch those on the same way, and they appear in the Summary tab beside the Stats measures.
Was this page helpful?
This opens the ticket form with your comment and a link to this page, so we can reply to you.
Submit a ticket