The ideal learning environment provides options for minimizing distractions to create a calm, safe space where students can engage in learning. For learners who may be sensitive to or distracted by motion, we have developed a feature within the Tuva Tools that allows users to disable all animations. This option ensures a focused and comfortable data analysis experience for all.
Please note, by default the Tuva Tools have animations enabled because we believe the majority of learners will benefit from them. These animations are carefully designed to provide learners with visual feedback, helping them draw connections between different graphical representations of the data.
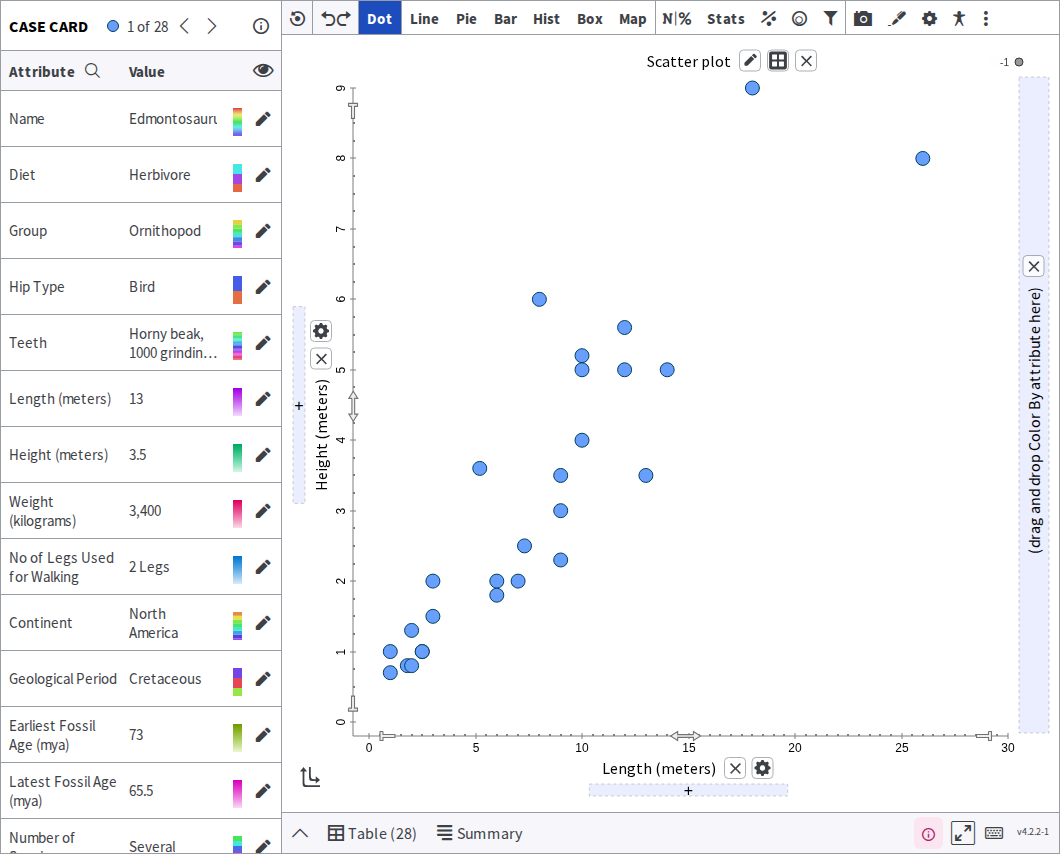
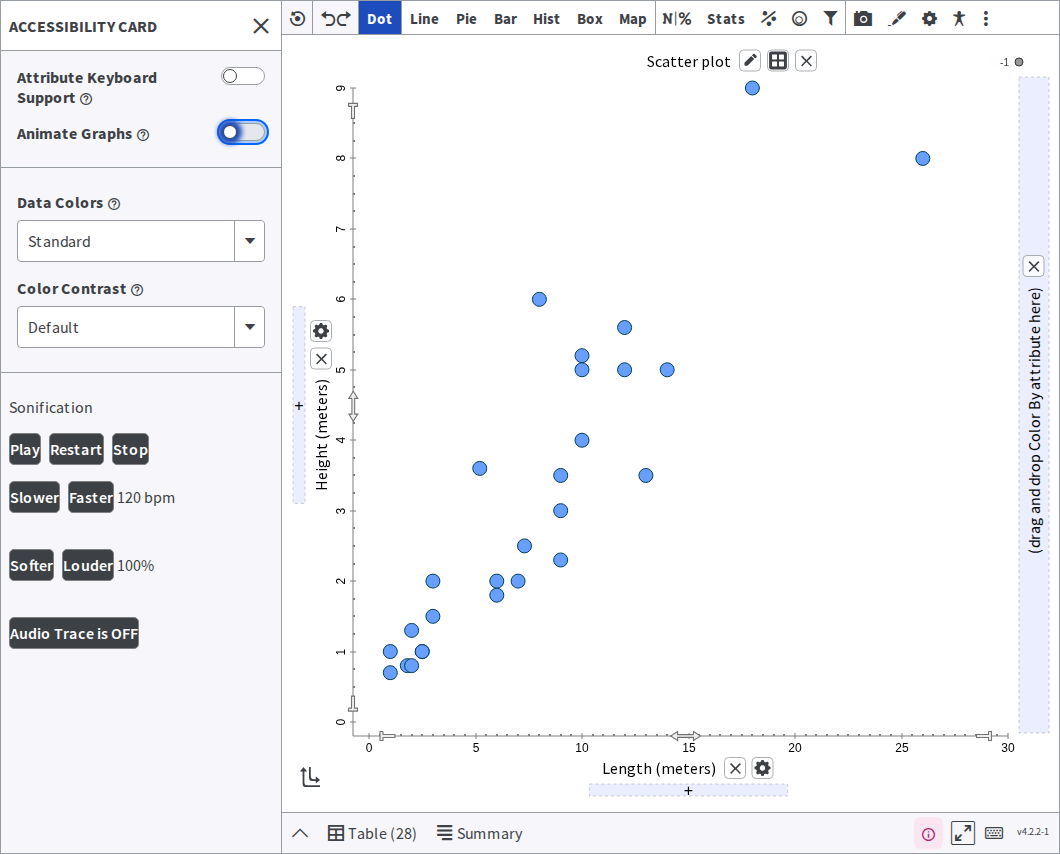
Animations are motion — a still picture cannot show one. What the screenshots below show is the setting, so you can tell which state you are in.
Turn animations off
Section titled “Turn animations off”1. In the toolbar, locate the accessibility button and click on it to open the Accessibility Card.
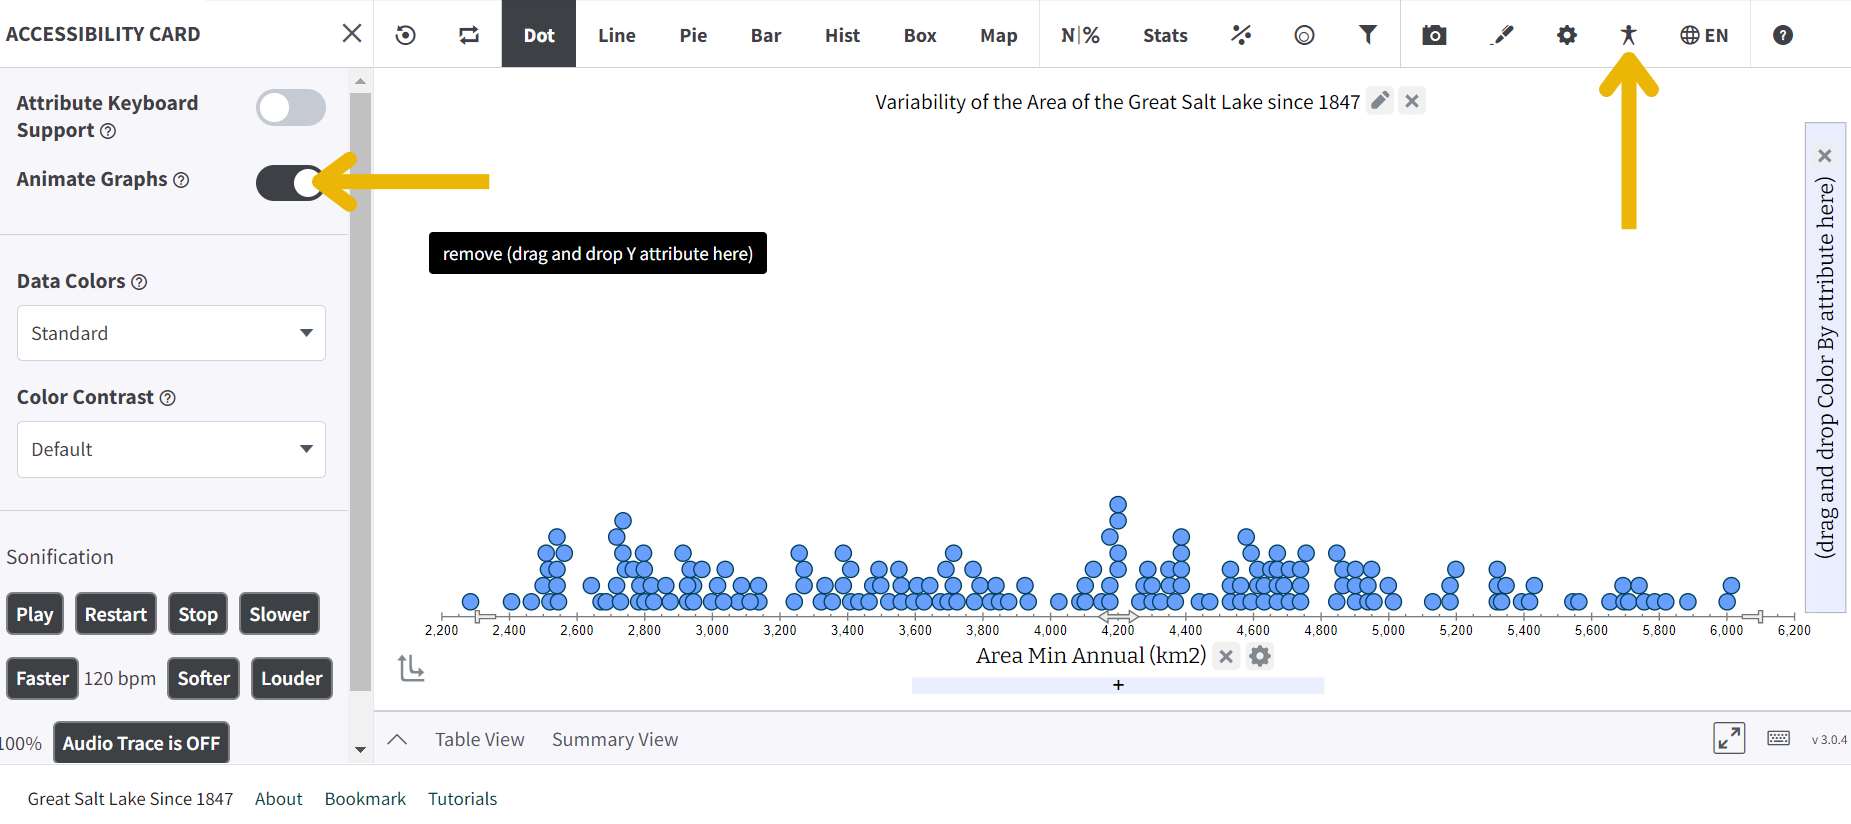
2. Find the Animate Graphs setting. By default the toggle sits to the right, and graphs animate:
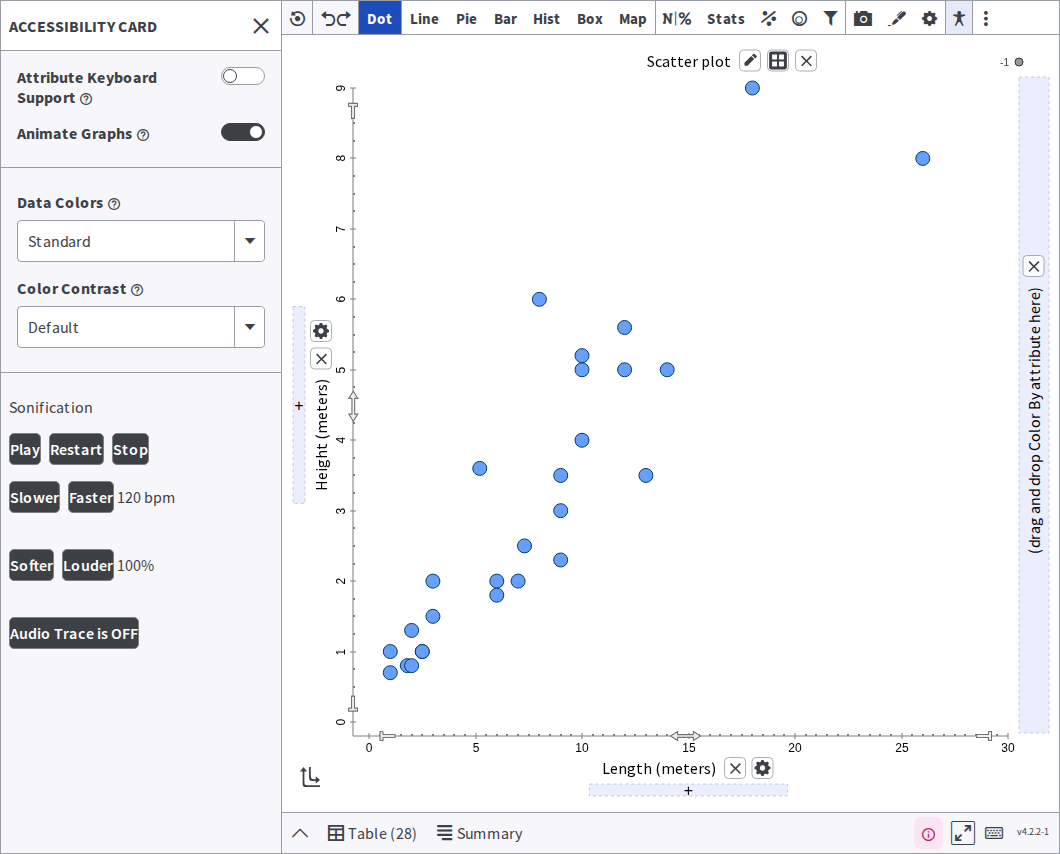
3. Slide the toggle left to disable animations. The plot itself looks the same; what changes is that it stops moving when you switch between graph types:
By turning off animations, individuals who are sensitive to motion can perform data analysis tasks without any visual distractions or potential discomfort.
If you have any further questions or need additional assistance, please don’t hesitate to reach out to our support team.
Was this page helpful?
This opens the ticket form with your comment and a link to this page, so we can reply to you.
Submit a ticket