
At Tuva, we define data literacy as the ability to visually explore and analyze data in various forms, ask questions of data, and use data as evidence for argumentation and decision making.
Data stories are a critical tool for the teacher working to building data literacy skills in their classroom.
Jump to: How to use data stories | For math | For science
What are Tuva Data Stories?
Section titled “What are Tuva Data Stories?”Tuva Data Stories are learning experiences that present data or data visualizations for quick sense-making about an engaging topic or key content idea. These learning experiences can be completed in 15 minutes or less, and can be used in a variety of ways in the classroom.

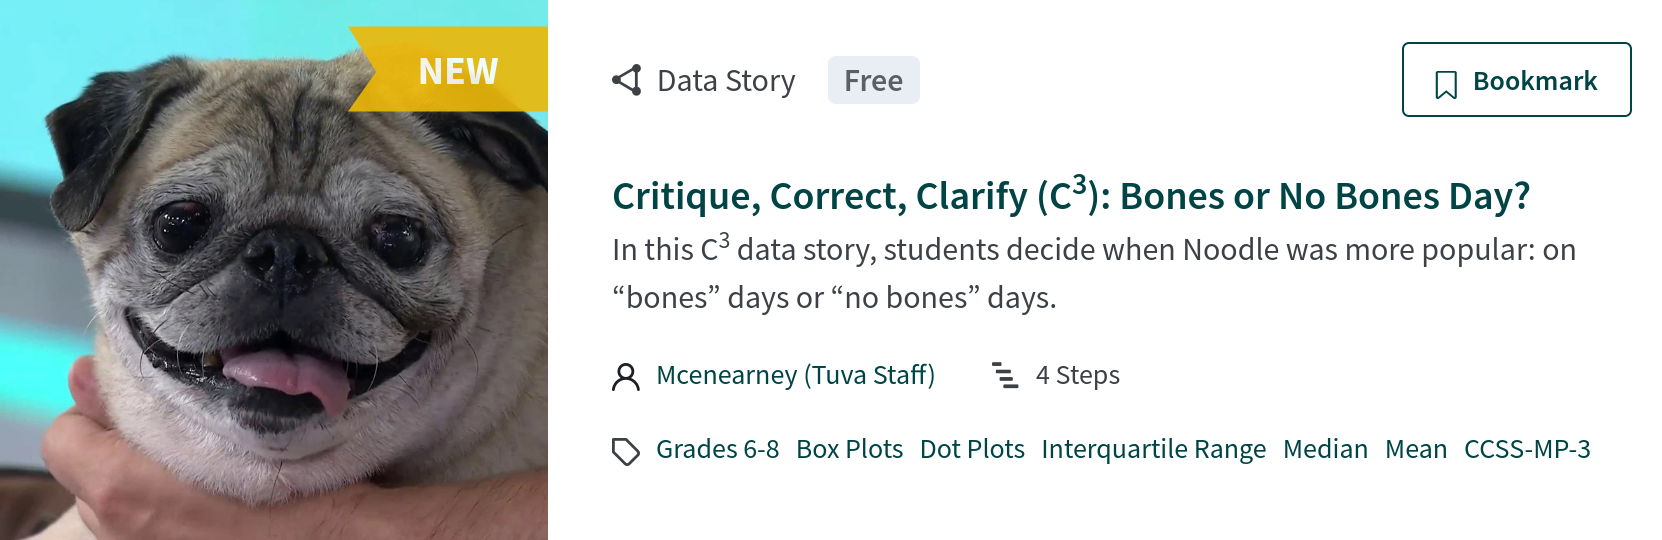
Screenshot of a Tuva Data Stories
Tuva Data Stories prompt students to 1) interpret specific aspects of a dataset, 2) practice a target data literacy skill (such a framing a question about a dataset or interpreting a pattern in data), or 3) simply initiate classroom discussion about data as evidence
How can I use data stories in my classroom?
Section titled “How can I use data stories in my classroom?”There are many ways to use a data story. Five that work well:
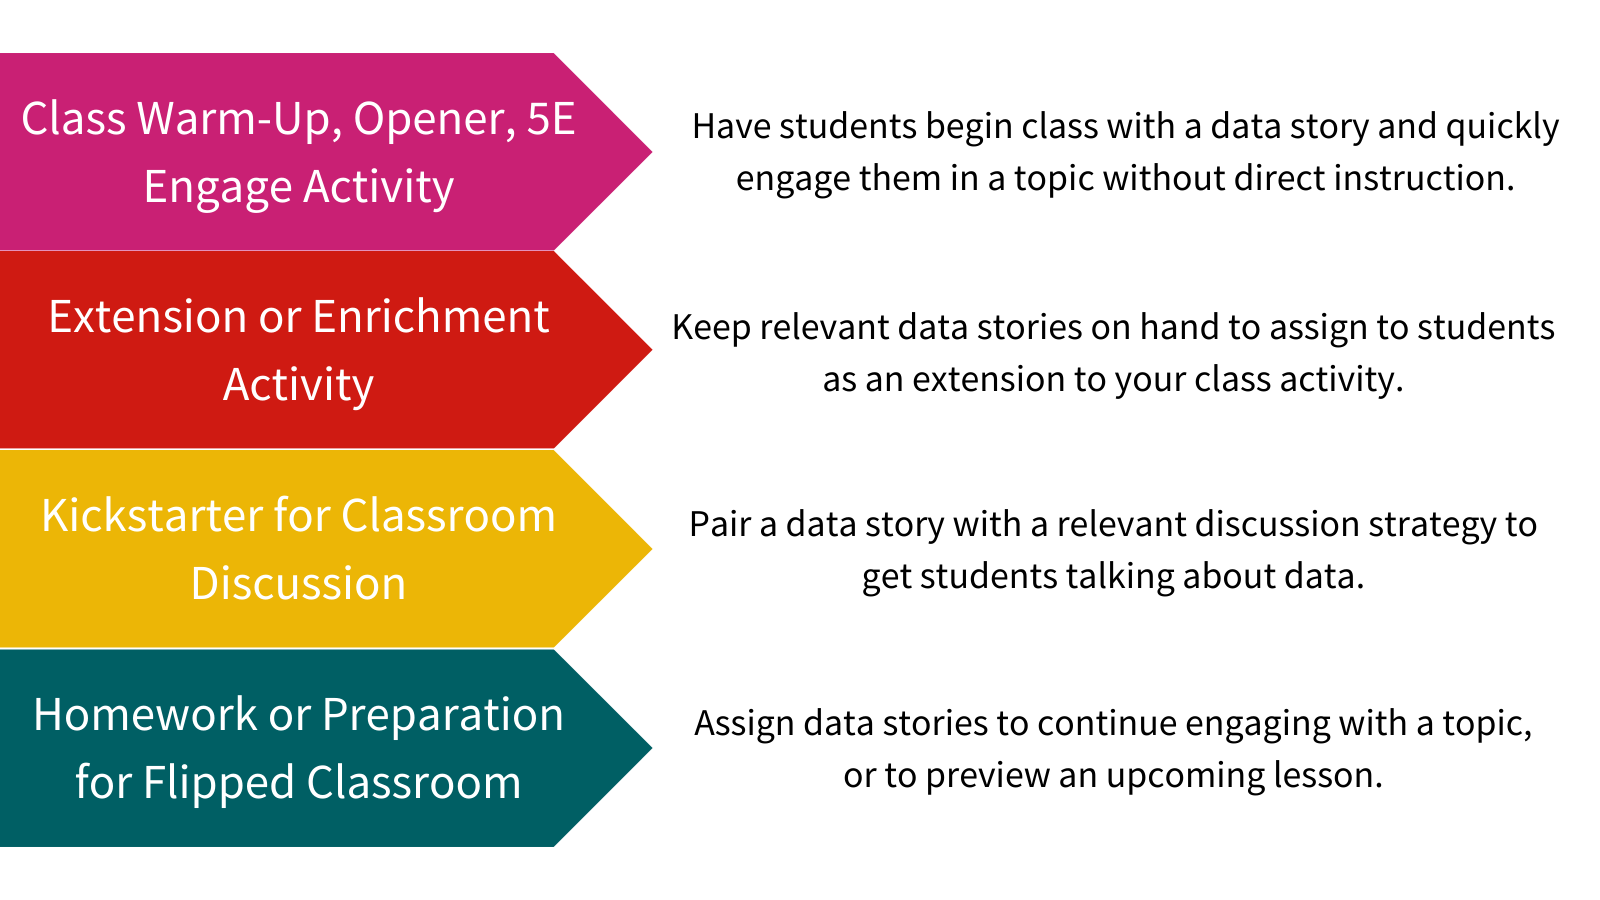
- As a warm-up or 5E Engage activity. Data stories need no direct instruction, so students can start one as they come through the door. Pick one that leads into the topic you are about to teach, or that surfaces what they already know.
- During a lecture. If you are working from a Tuva dataset, pause at the graph and have students work through the data story before carrying on.
- As an extension. Keep a relevant data story to hand for students who finish the planned activity early.
- As a kickstart for class discussion. A data story gives everyone a shared thing to react to, which is an easier way into a discussion than a cold question.
- As homework, or for a flipped class. Assign one to reinforce what you covered, or to prepare for what is coming.
Four of those five, side by side:
Tuva Data Stories for Math
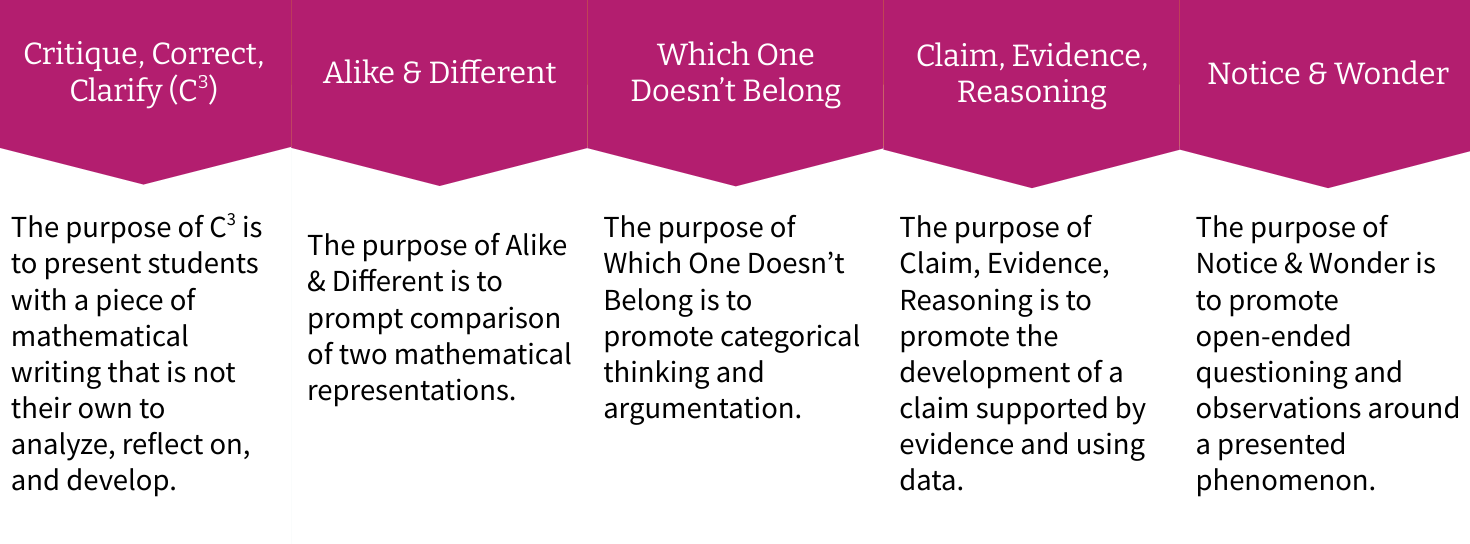
Section titled “Tuva Data Stories for Math”Tuva Data Stories for Math are organized into 5 buckets based on the instructional strategy they employ. Each strategy is grounded in research on math and data literacy education and serves a different purpose.
Tuva Data Stories for Science
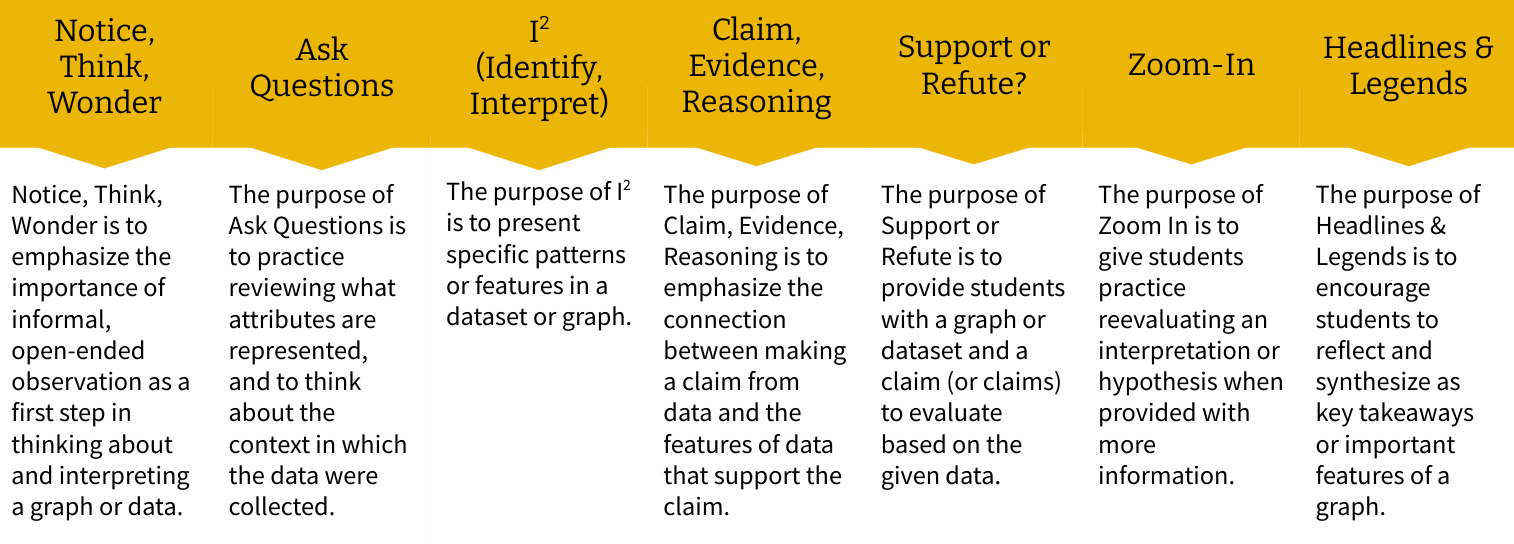
Section titled “Tuva Data Stories for Science”Tuva Data Stories for Science are organized into 7 buckets by instructional strategy. Each data story instructional strategy is based on research in science and data literacy education. The 7 science strategies are below.
Was this page helpful?
This opens the ticket form with your comment and a link to this page, so we can reply to you.
Submit a ticket