Grade 6: Introduction to Creating a Box Plot
Lesson Topic: Constructing a Box Plot (IM Grade 6 Unit 8 Lesson 16) |
Objective: Students will be able to: - Construct a box plot for a set of data by dividing the data set into quartiles
- Know what information a box plot shows and how it is constructed
|
Time Required: 75 minutes |
Materials Needed: - Teacher computer with internet access
- 1 computer/laptop per student with internet access
- Student Handouts from IM Lesson
|
Teacher Preparation: |
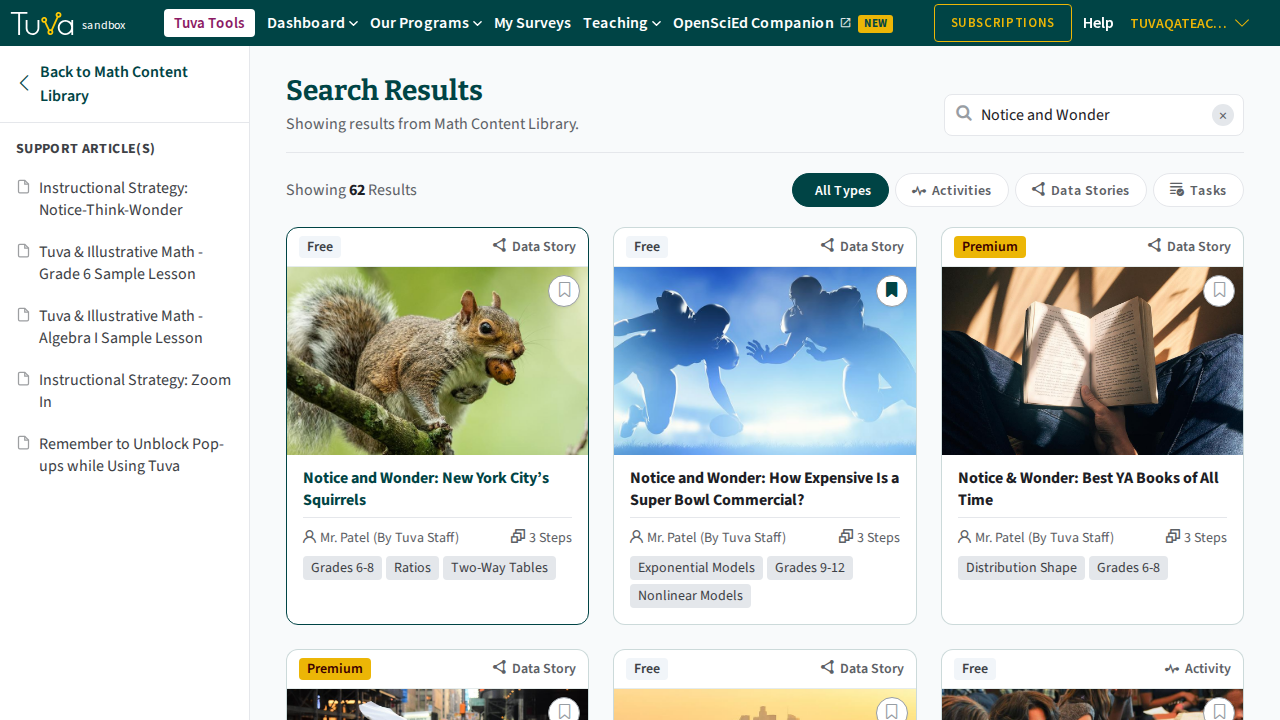
Engage (15 minutes): - Launch the Notice and Wonder warm-up from the IM lesson (the puppy weights table). Tuva’s own “Notice and Wonder: Puppy Weights” activity is no longer in the library; another Notice and Wonder data story, such as “Notice and Wonder: New York City’s Squirrels”, works for the same routine. Give students independent “think time” to collect or write down thoughts.
- Class discussion might focus on which weights are most common, the range of the weights, or the organization of the weights in the table.
- Prompting questions to students might focus on other ways that the data could be presented or organized or other questions we might want to know about the data.
|
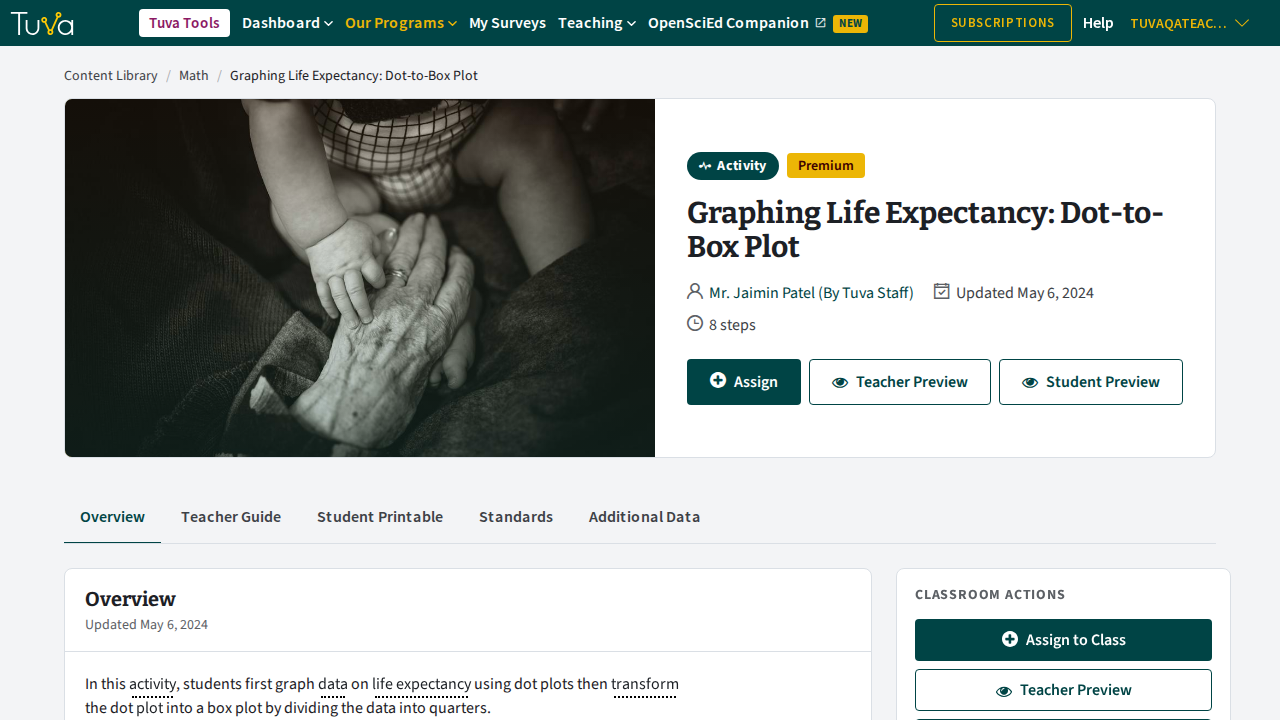
Explore (30 minutes): - Students open the Tuva Graphing Life Expectancy: Dot-to-Box Plot
- Students work through the activity independently receiving formative assessment feedback through the auto-graded features.
- Pause student activity where students get stuck or confused to discuss as a whole class.
- Assist students as needed to reach the final step of drawing the box plot.
|
Explain (10 minutes): - Project final step of Tuva activity with the box plot drawn on the board.
- Go through the names of each of the important numbers in the five-number summary of the box plot and discuss the method that students used to find those values (cutting the data in half and then into quartiles).
- Go back through the steps of the activity as needed to make sure students can explain the process used.
- As a class, determine the interquartile range (IQR) of the box plot and discuss what that number tells us about the life expectancy.
- If time allows, discuss what information can be seen in the box plot that wasn’t as obvious in the dot plot.
|
Elaborate (15 minutes): - Students complete the Lesson 16 Practice Problems independently or with a partner.
- Review the problems as a whole class, focusing on common misconceptions.
|
Evaluate (5 minutes): - After reviewing the practice problems, have students answer the following wrap-up questions:
- What is one piece of information that we can find from looking at a box plot?
- What is one important difference between a box plot and a dot plot?
- Collect student work on practice problems as needed.
|
Additional Lesson Strategies: - Pause students as needed during the Tuva activity to model how to use the tools if students are struggling with that.
- Leave the work from the Explore/Explain on the board so that students can refer to it as they work on the practice problems.
|
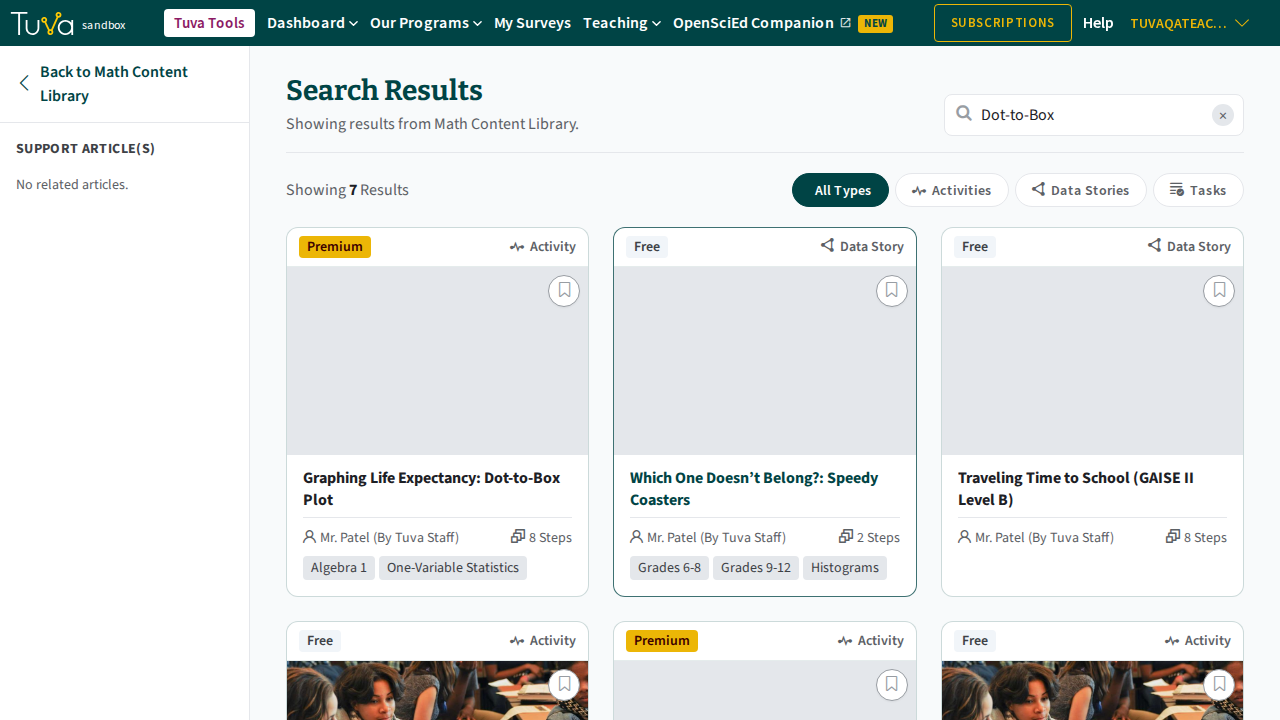
Search the content library for “Dot-to-Box” to find the activity, then use Assign to give it to your class (see preview and assign an activity).
For the Engage step, a search for “Notice and Wonder” lists the data stories you can launch.