
Everything in Tuva happens on a dataset page: a table of data plus the tools for graphing it. To follow along, open any dataset from the content library — the screenshots here use Man’s Best Friend, a dataset of 16 dog breeds.
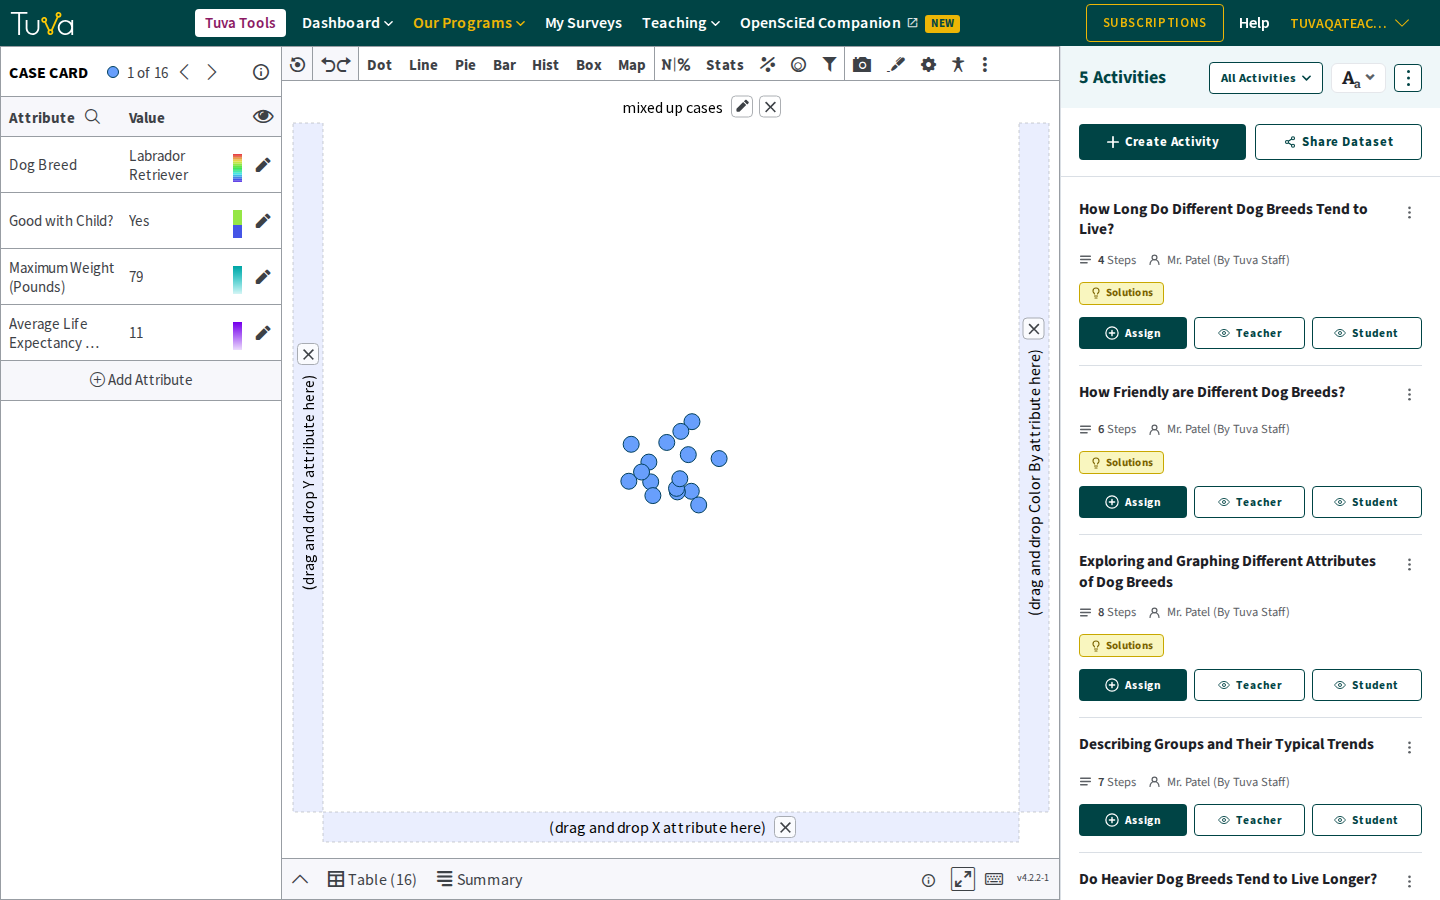
The page has five regions.
The case card
Section titled “The case card”Down the left. It lists the dataset’s attributes — the columns of the data table, such as a dog breed’s maximum weight or life expectancy — and shows their values for whichever case you have selected. A case is one row: one dog breed, one cicada, one state.
Each attribute shows its name, its value for the selected case, and its colour: a gradient for a numerical attribute, distinct colours for a categorical one.
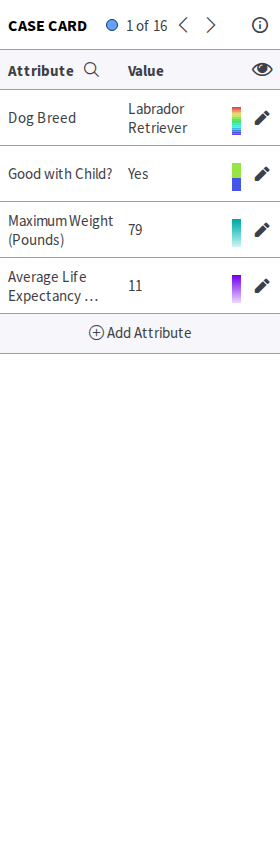
Editing an attribute is covered in edit a categorical attribute and edit a numerical attribute.
The toolbar
Section titled “The toolbar”Across the top: the graph types and the tools. Which chart should I use? maps them out, and the graphs and charts guides cover them one at a time.

The graphing area
Section titled “The graphing area”The middle, where your graph is drawn.
The table view
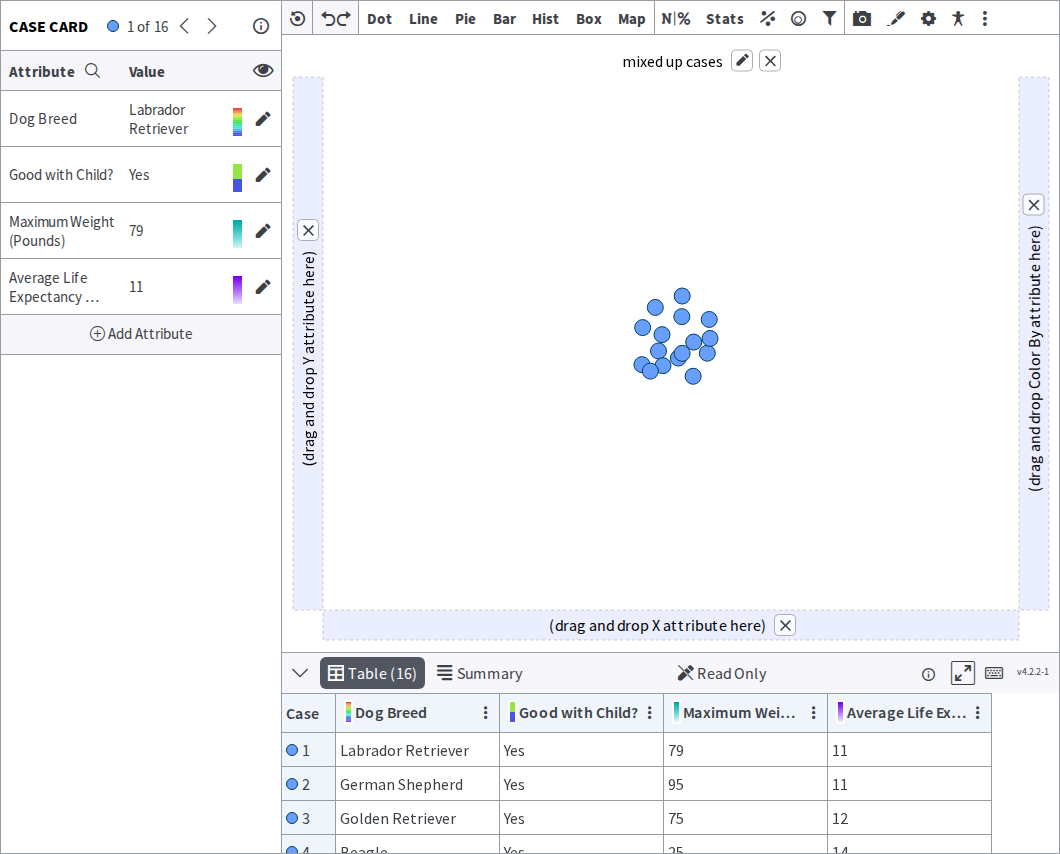
Section titled “The table view”Along the bottom: the data as a spreadsheet. Each column header matches an attribute in the case card.
The activity panel
Section titled “The activity panel”Down the right: the activities built on this dataset, each with buttons to assign or preview it. While a student is working through an activity, its instructions and questions appear here.
The three views stay in sync
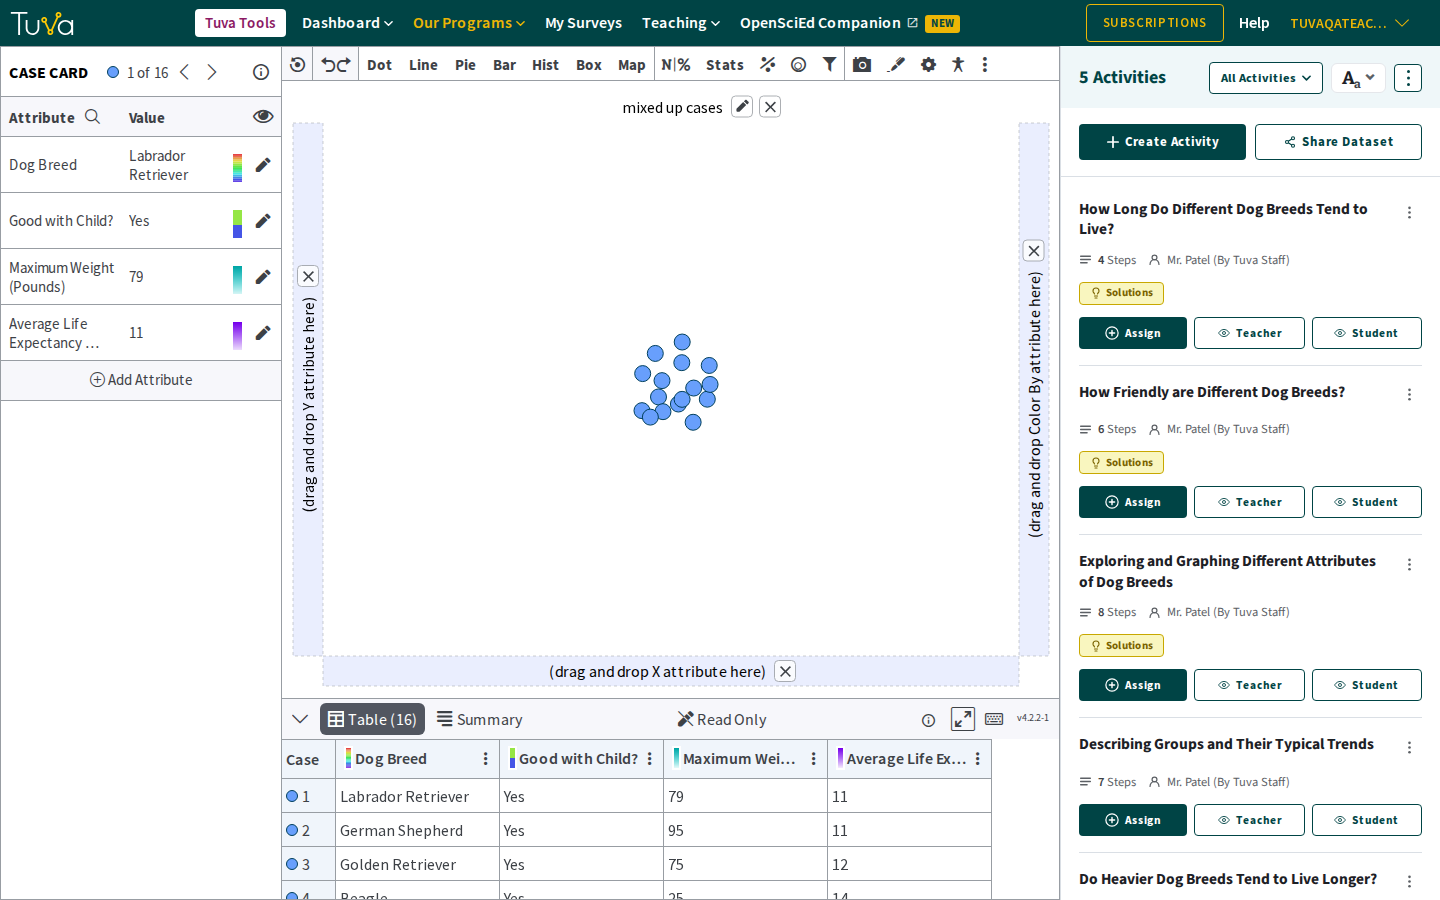
Section titled “The three views stay in sync”The case card, graphing area and table view are three views of the same data. Select a point on the graph and its row highlights in the table while the case card fills with its values.
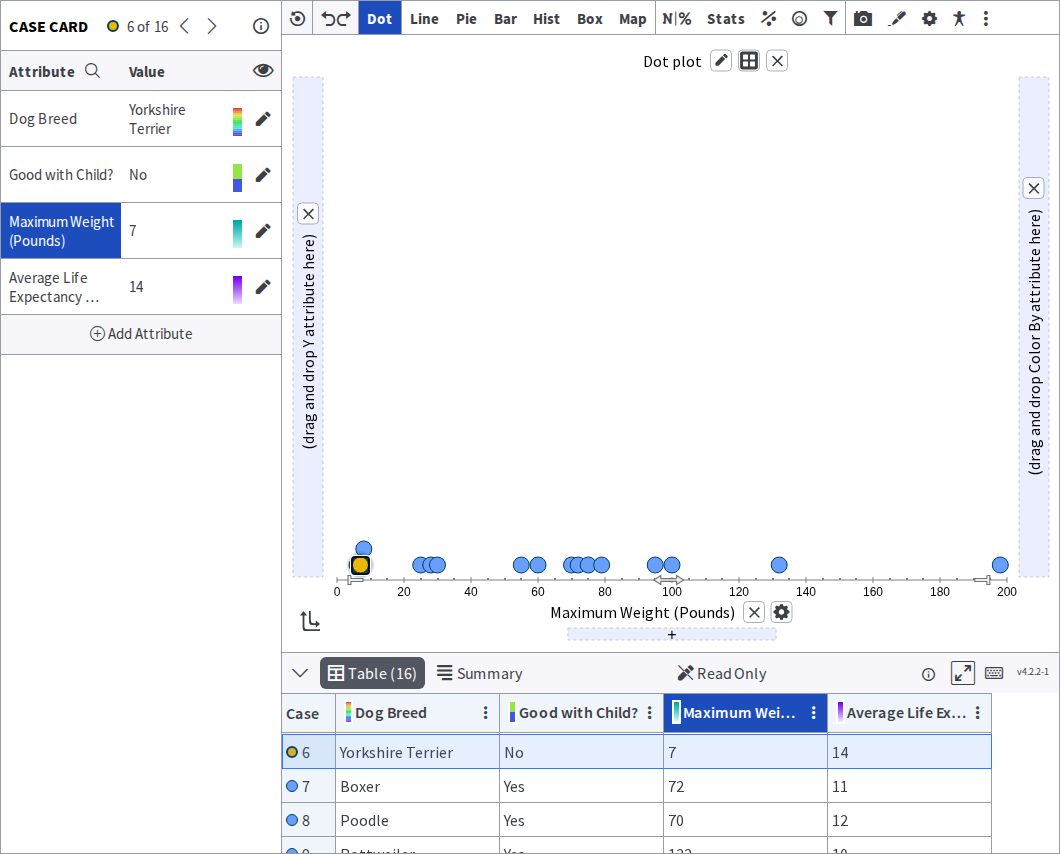
It works the other way too — click a row in the table and the matching point highlights on the graph.
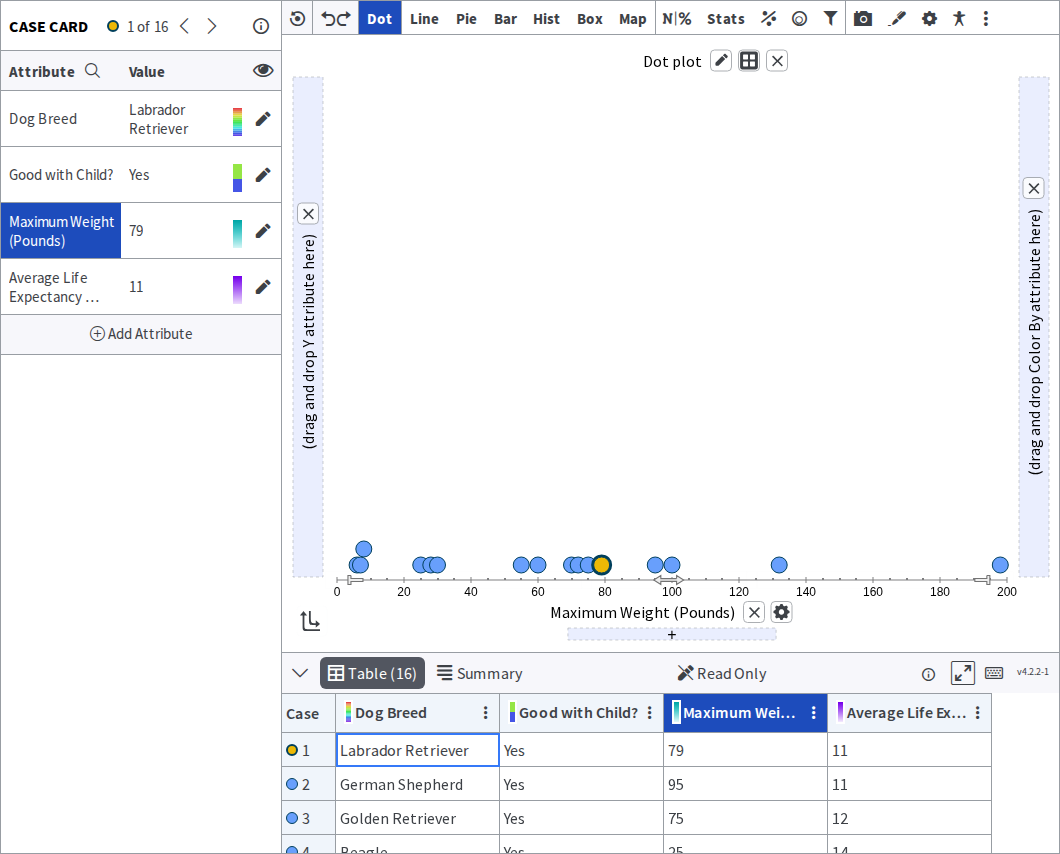
The case card answers what is this one case like?; the table view answers where does it sit among the others? Moving between them is how students go from noticing a point to asking why it is where it is.
Was this page helpful?
This opens the ticket form with your comment and a link to this page, so we can reply to you.
Submit a ticket