
Tuva’s data and graphing tools allow teachers and students to analyze their data using the least squares line, also known as the line of best fit.
Step 1: Add the LSRL from the Model Data Menu
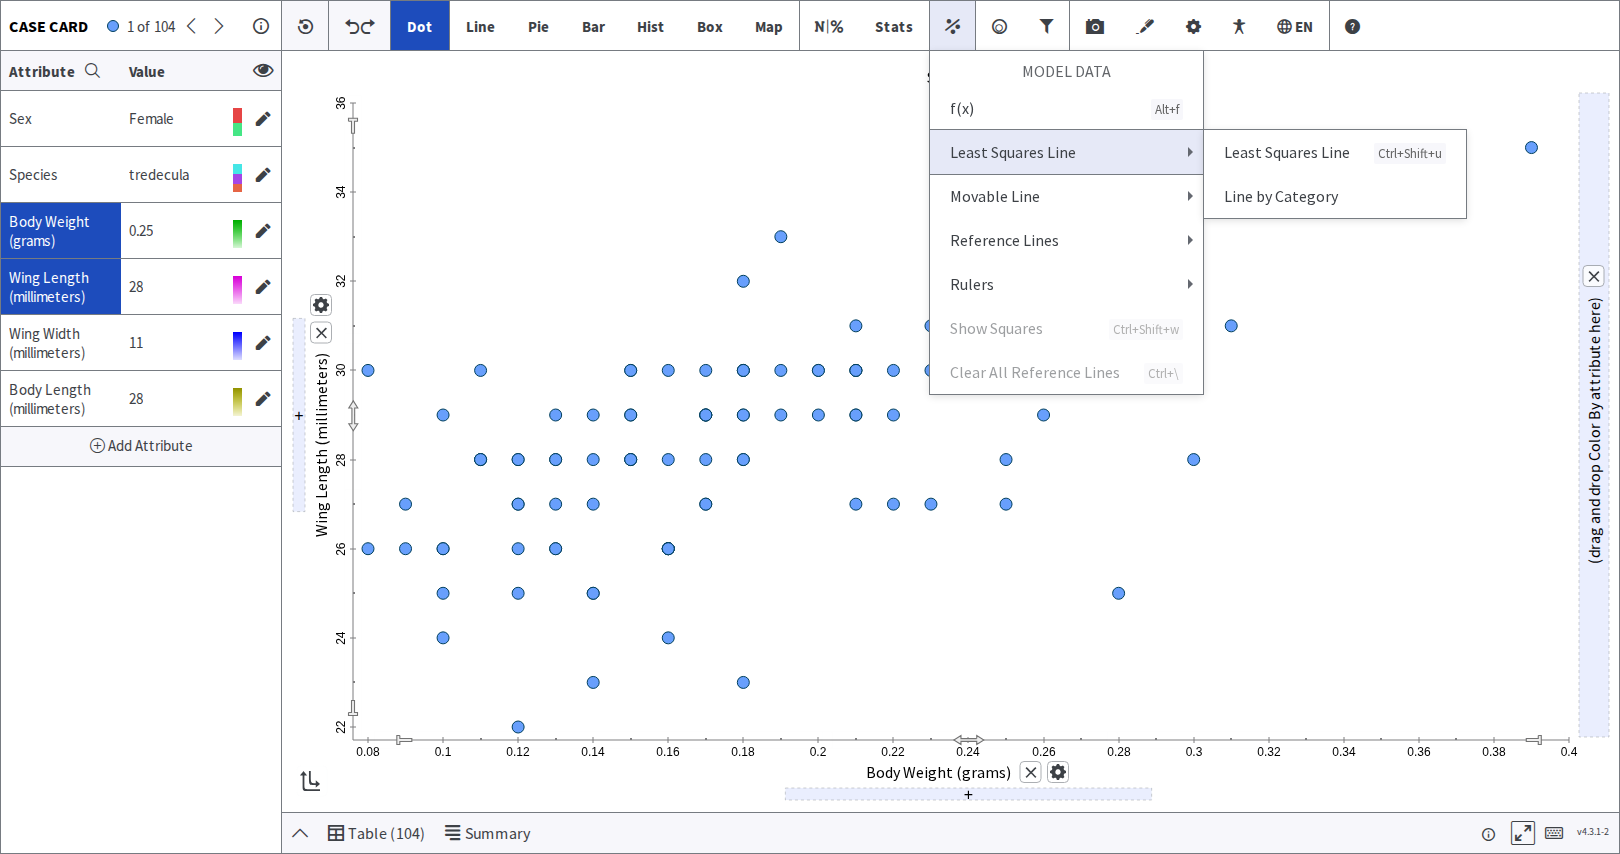
Once you have created your scatter plot, you need to click open the menu from the toolbar. You can then choose the Least Squares Line from the drop-down to add it to the Scatter Plot.
 |
Step 2: View the Equation of the LSRL
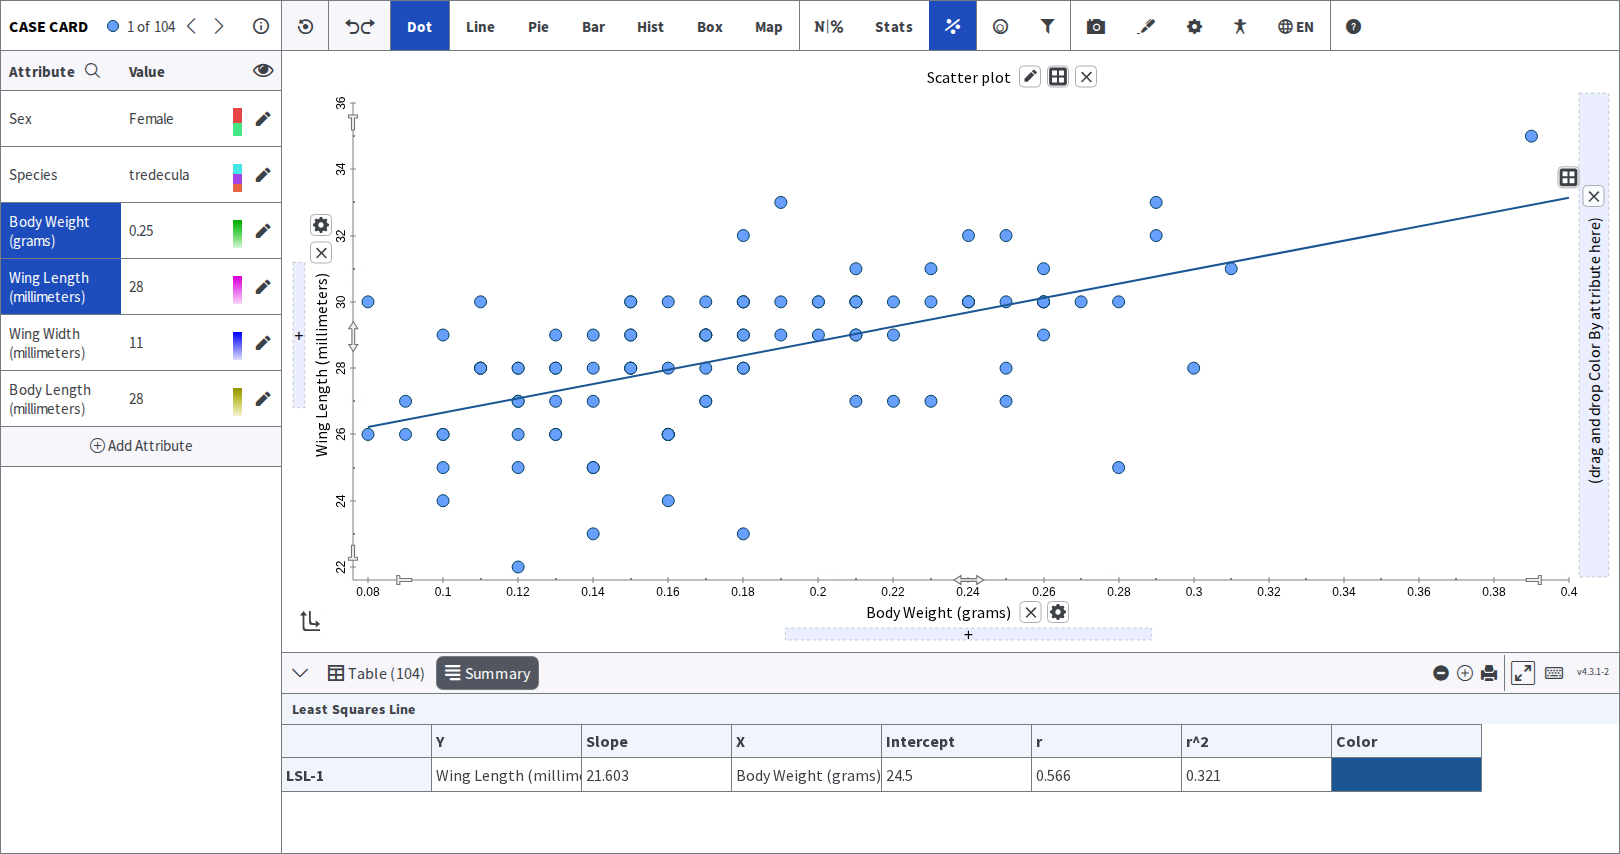
Now that the least squares line is added to the plot, you may view the equation and its components in one of two ways: hovering on the line to view the equation or opening the Summary tab (the Summary View) below the plot and seeing its parameters listed in the table.
 |
Adding Multiple Least Squares Lines
Section titled “Adding Multiple Least Squares Lines”Within a scatter plot, Tuva allows you to separate data points by category. How? You simply add a Categorical attribute to the Legend.
Additionally, you can generate a least squares line for each of these categories.
Here are the steps:
Step 1: Create a Scatter Plot with a Categorical Attribute in the Legend Area
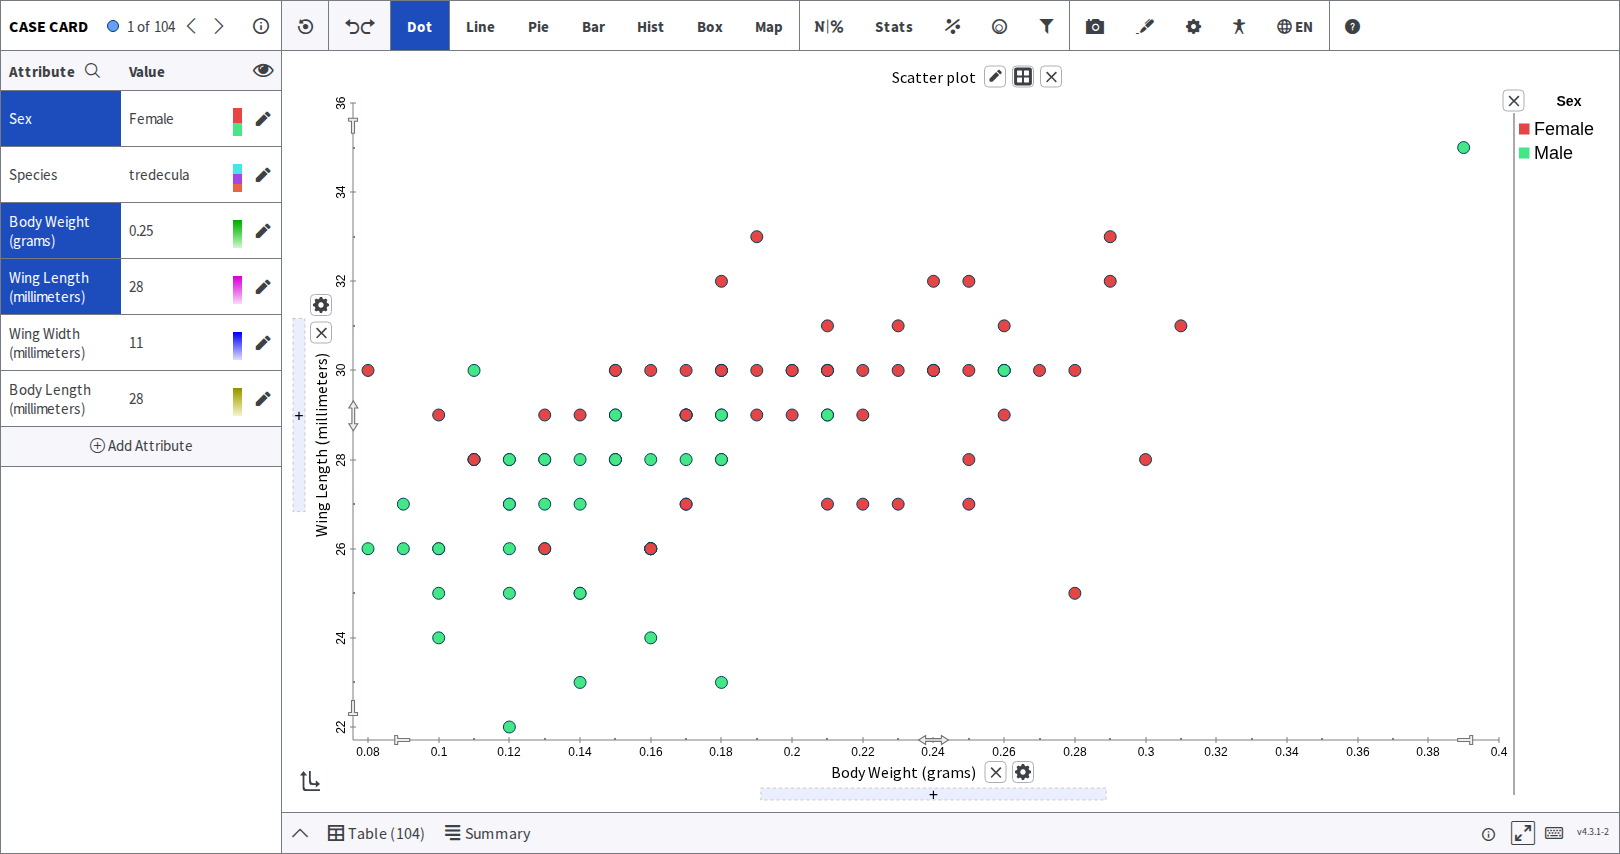
Once you have created a scatter plot, you need to select a categorical attribute by single-clicking it in the case card or drag and drop it in the Legend Area directly.
 |
Step 2: Add Multiple Least Squares Lines
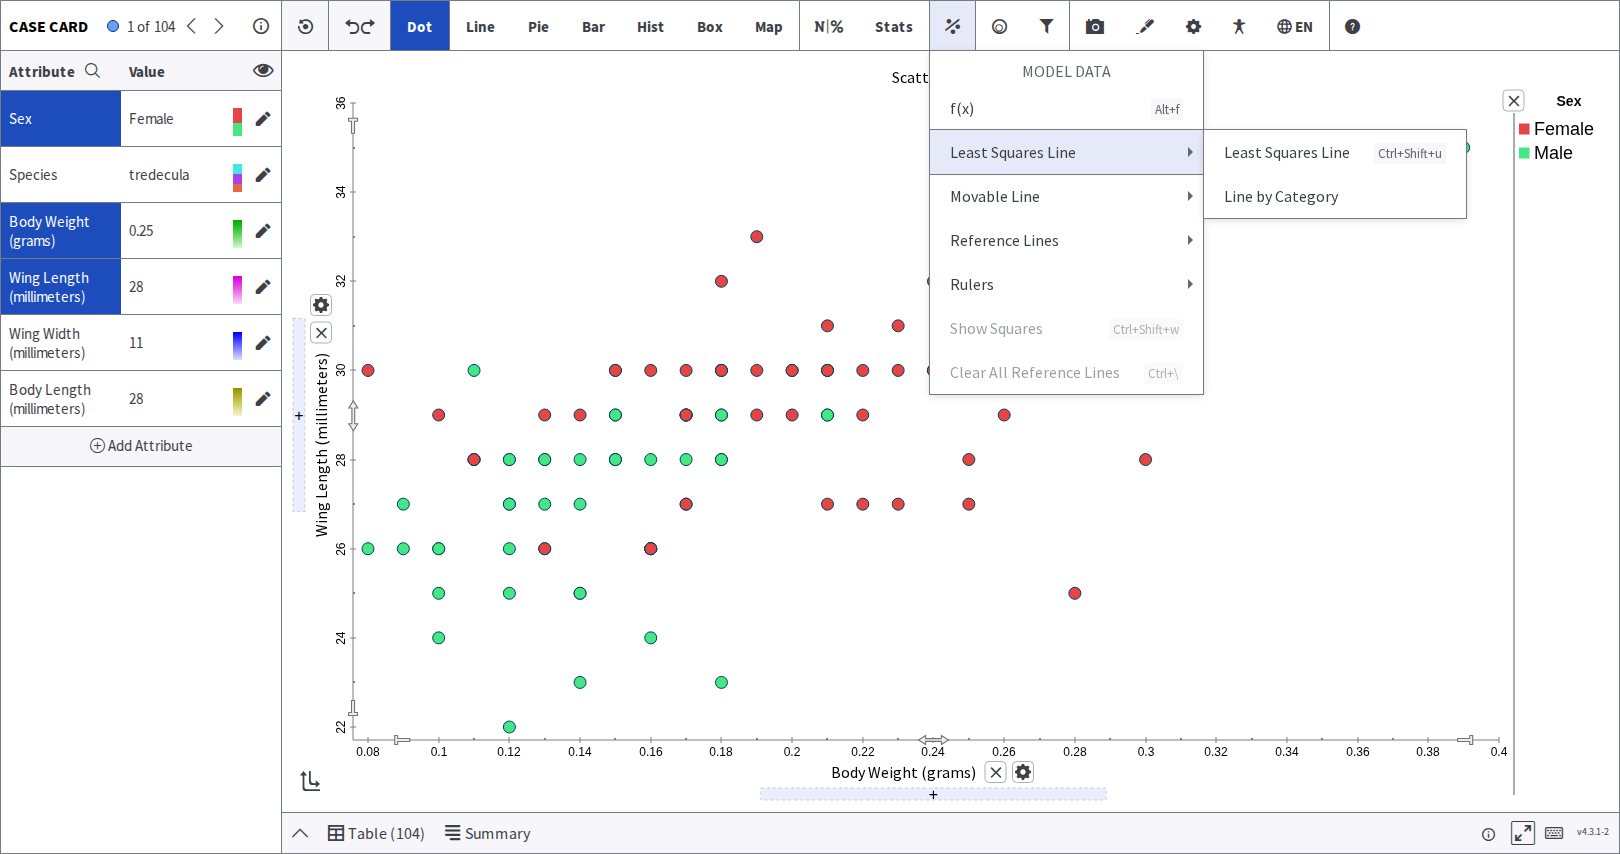
Next, you need to click open the menu from the toolbar. You can then choose Line by Category from the drop-down to add multiple Least Squares Lines to the Scatter Plot.
 |
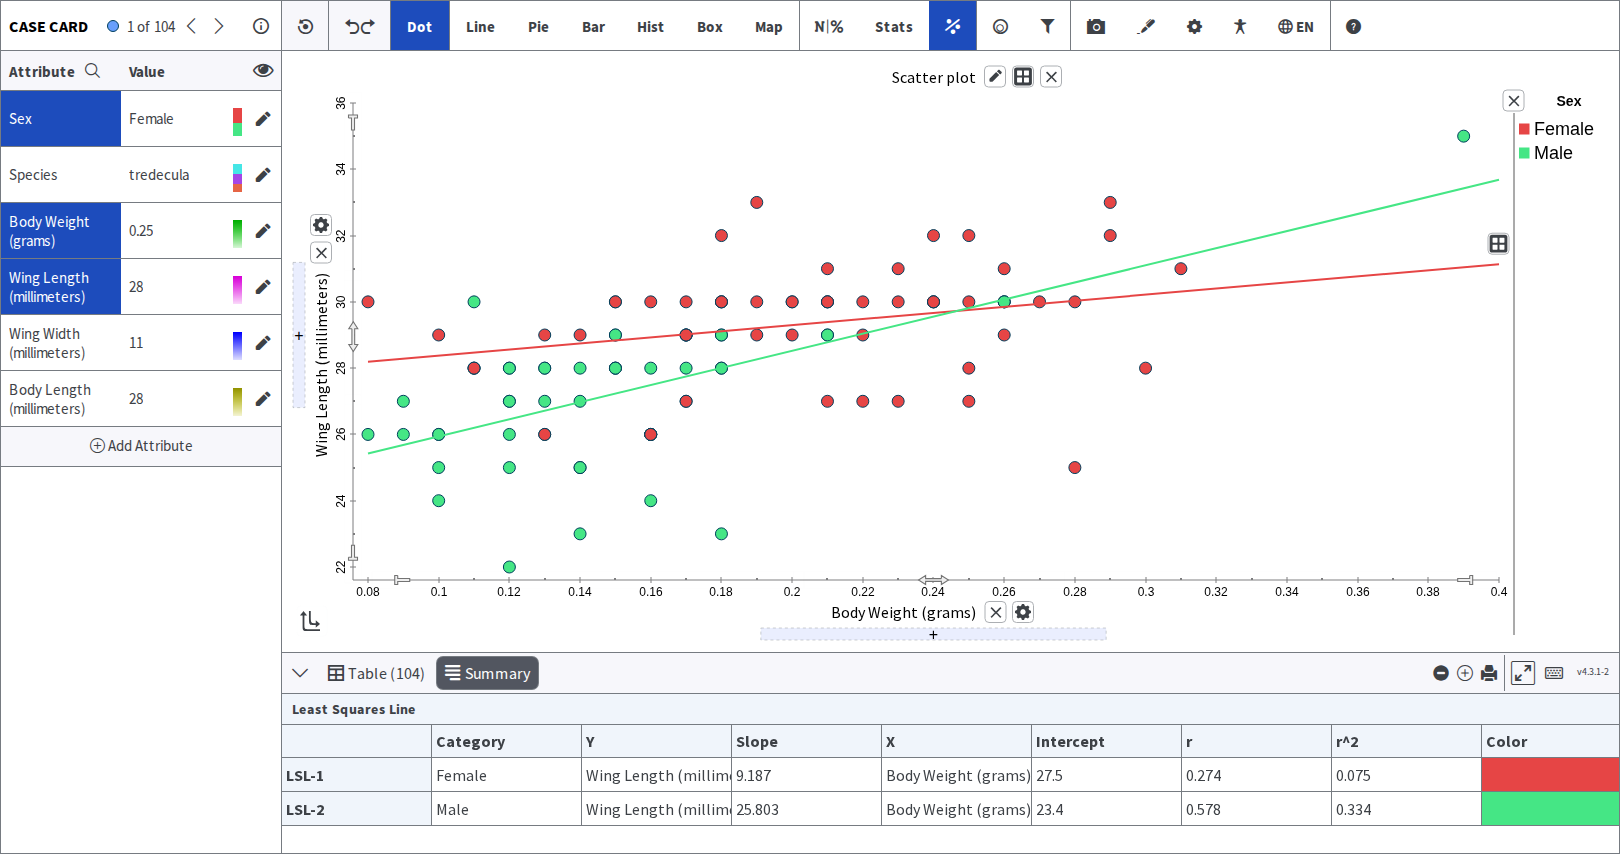
Step 3: View the Equation of the Lines
Now that the least squares lines are added to the plot, you may view the equation and its components in one of two ways. Either by hovering on the line to view the equation or by opening the Summary tab (the Summary View) below the plot and seeing its parameters listed in the table.
 |
Was this page helpful?
This opens the ticket form with your comment and a link to this page, so we can reply to you.
Submit a ticket