
Zoom-In data stories prompt students to look at a portion of a graph or table in greater detail by “zooming in” or “zooming out,” or to consider how the addition of new information affects an interpretation.
Goal: Students look more closely at data to explain patterns or modify an interpretation or prediction when presented with new information or a view of data at a different scale.
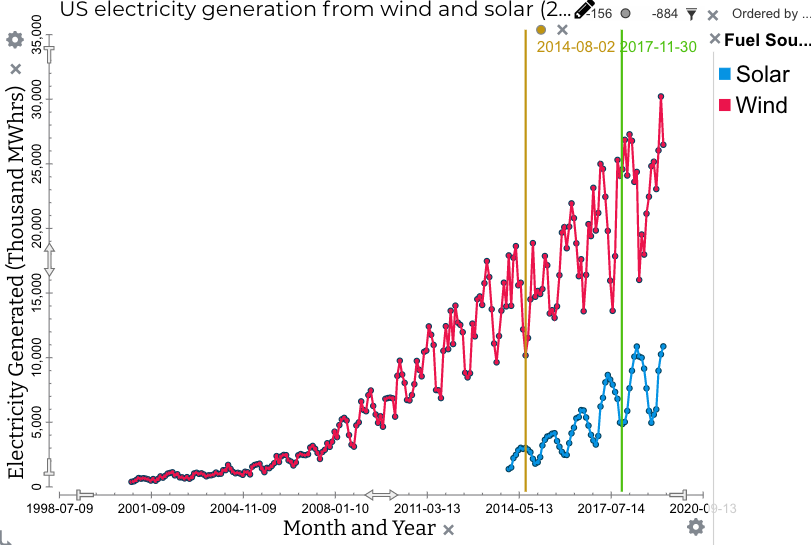
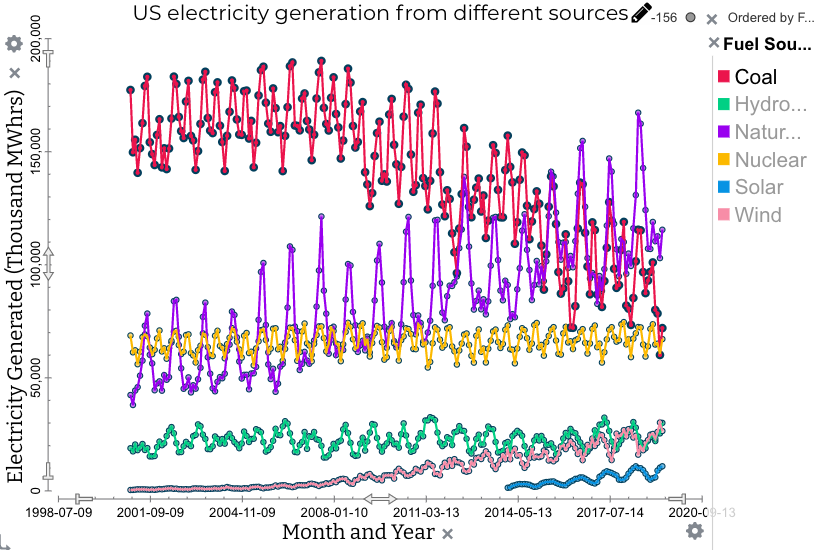
Example: Tuva Data Story Where Does Electricity Come From? Students compare electricity generation by wind and solar during recent decades. Then explain how and why patterns change when other sources of energy are added. Part 1:
Part 2:
|
Implementation ideas:
Use Zoom-In data stories to introduce the NGSS cross-cutting concept of Scale, Proportion, and Quantity. Students can create a headline for graphs at different scales, and compare the key idea communicated by each graph.
Related resources:
Ritchart, R.; Church, M.; Morrison, K., 2011. Making Thinking Visible: How to Promote Engagement, Understanding, and Independence for All Learners. San Francisco: Jossey-Bass.
Was this page helpful?
This opens the ticket form with your comment and a link to this page, so we can reply to you.
Submit a ticket