
“Overall, using Tuva greatly sped up the process of creating graphs. Instead of using that time to “make” a graph [in Google] they were able to go more in depth with analyzing what the graphs says about their results.” - Toni B., Science Teacher
Spreadsheet applications such as Microsoft Excel and Google sheets are useful for organizing data, but they are not designed for learning to visually explore data in different ways quickly and with a statistical mindset.
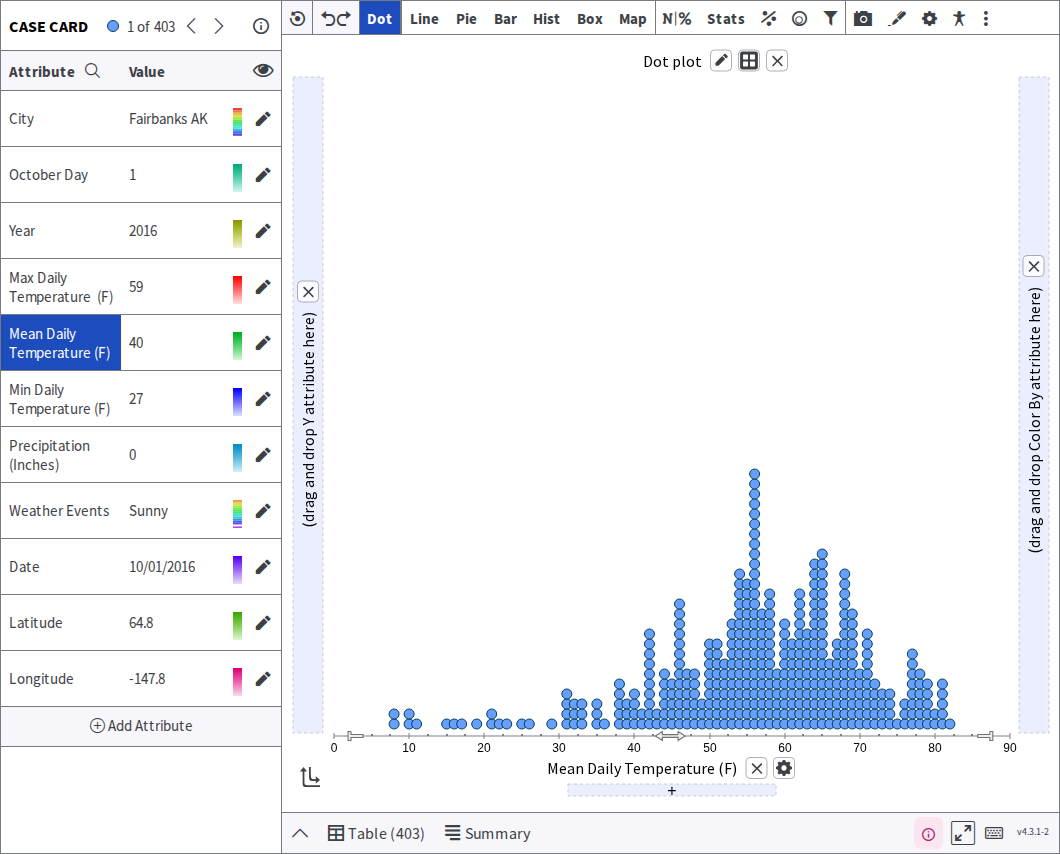
Comparing Tuva Tools and Microsoft Excel for teaching and learning data, graphing, modeling, and statistics.
Tuva | Spreadsheet Software (Microsoft Excel, Google Sheets) |
Students can quickly and intuitively explore data by simply dragging and dropping data attributes to either axis. | Graphing in spreadsheets involves numerous technical steps, range selections, and clicks. |
Students can transition to different ways of looking at data quickly without getting bogged down in multiple technical maneuvers between graph and spreadsheet; they can keep focused on the data. | Technical maneuvers consumes much time when graphing in spreadsheets. |
Students can develop an aggregate view of data by visualizing how data are distributed along a number line using dot plots, box plots, or histograms. They can use exploratory tools such as dividers, movable reference lines, and an annotation tool to help them reason about group properties of data and make sense of it in a real-world context. | Distributions of data are not easily made in spreadsheet applications. |
Students can quickly filter data to look only at selected categories or sub-ranges of the data, or to see how including or excluding parts of the data affects statistical measures. | Filtering data in spreadsheets often requires reorganizing the spreadsheet and re-creating a graph from scratch. |
Students can visually compare graphs using summary statistics (mean, median, least squares line, standard deviation, mode) intuitively and with minimal clicking. |
|
Students can visually (and quantitatively) compare variability between groups and reason about what variability means in terms of predictability and uncertainty in claims. | Most spreadsheet program son’t easily make dot plots or box plots, so discussion of variability and its implications for uncertainty in claims are often missing from students’ reasoning about data. |
Students can see the unique combination of attributes of any individual case (sample), and how a case relates to to the rest of the group, using Tuva’s interactive display that represents data in several ways at once. |
A worked comparison
Section titled “A worked comparison”The same question, asked of the same weather data, in a spreadsheet and in Tuva.
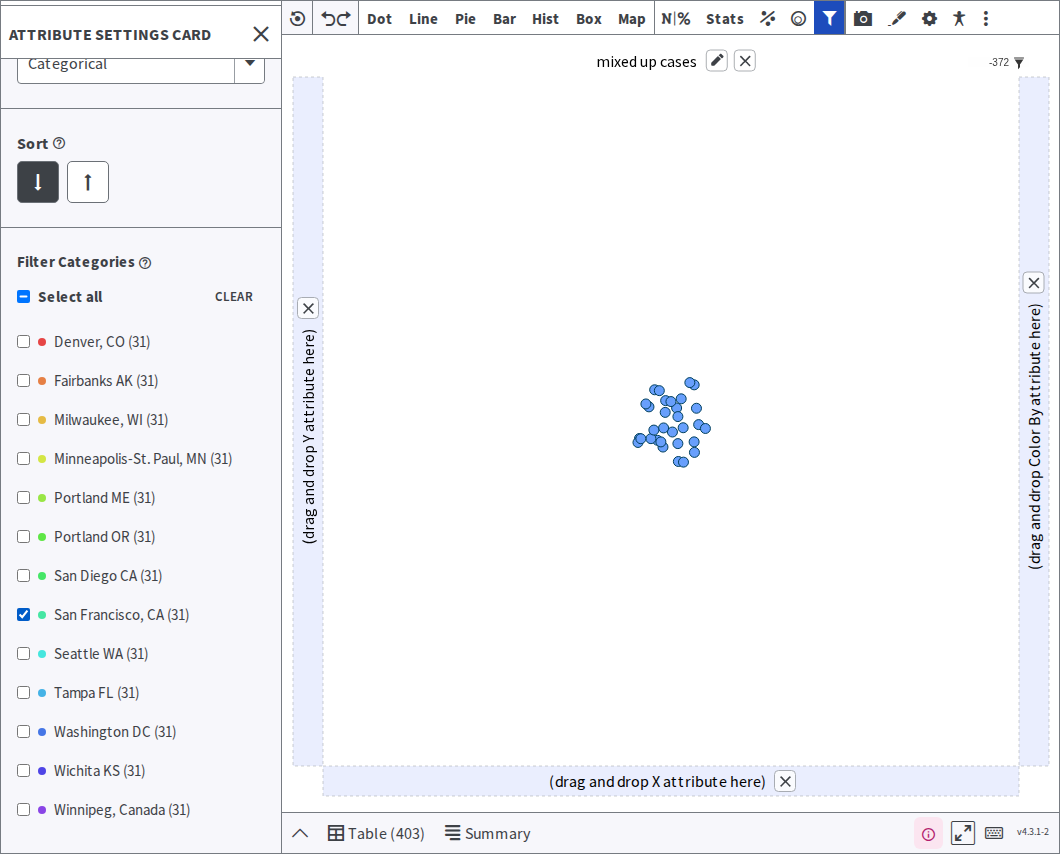
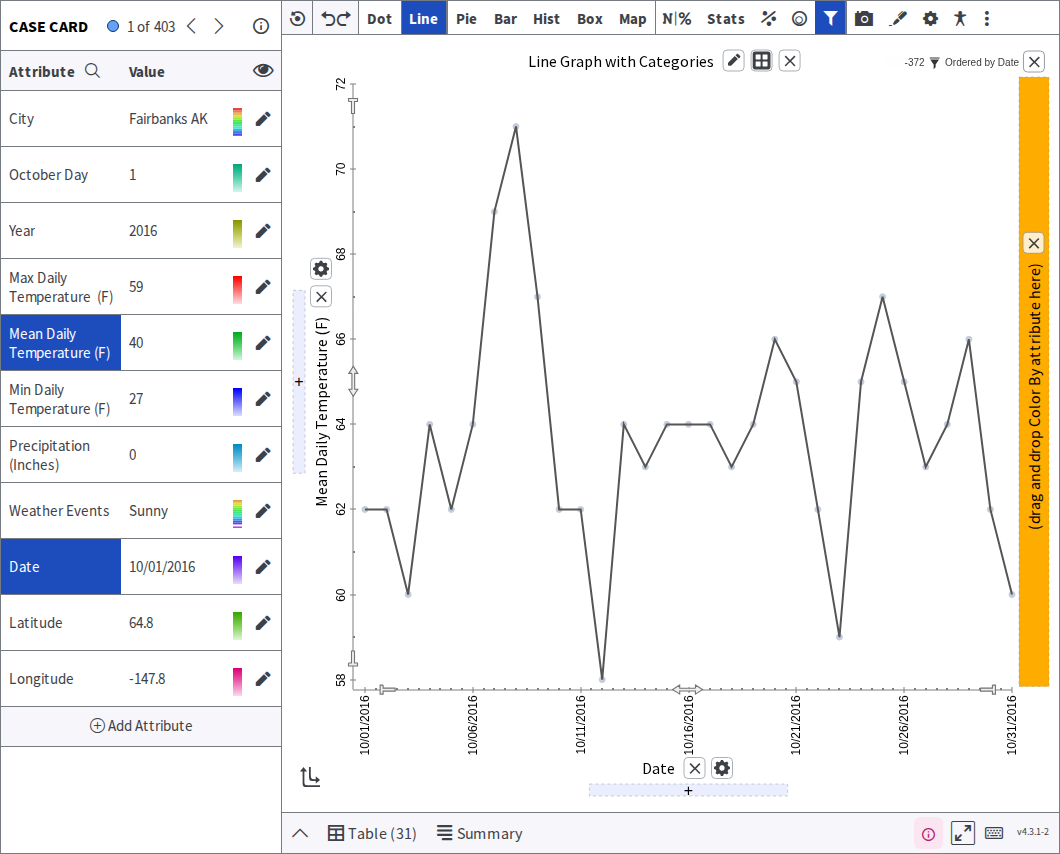
What were average daily temperatures in San Francisco during October 2016?
Section titled “What were average daily temperatures in San Francisco during October 2016?”| In a spreadsheet | In Tuva |
|---|---|
| Highlight three columns · Insert → Chart · pick Line graph · Insert · click the X axis · type a label · Enter | Click the pencil by City · click Clear, then check San Francisco, CA · close the settings card · drag Date to the X axis · drag Mean Daily Temperature (F) to the Y axis · click Line, then choose Line Graph by Category |
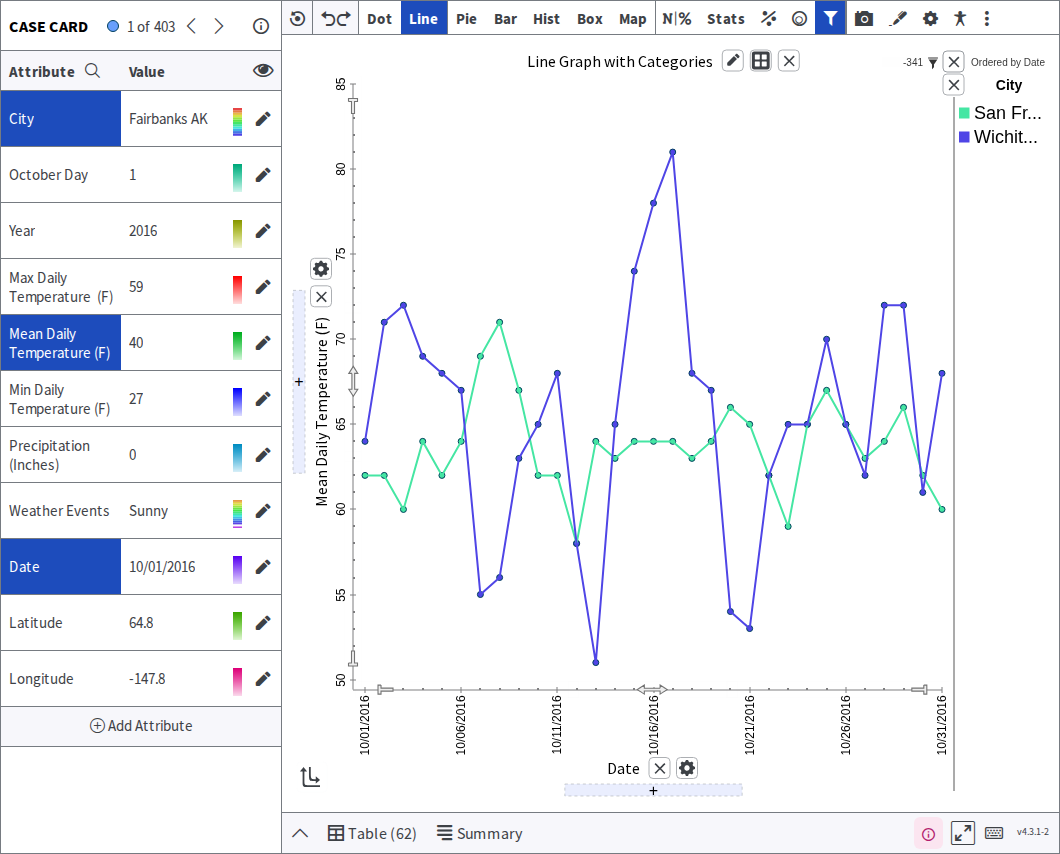
How did those temperatures compare with Wichita, Kansas?
Section titled “How did those temperatures compare with Wichita, Kansas?”| In a spreadsheet | In Tuva |
|---|---|
| Right-click the graph · Advanced edit · Recommendations · Select Data Range · highlight the cells · OK | Click the pencil by City · check Wichita KS · close the settings card · drag City to the Color By zone so each city gets its own line |
How did the variability compare?
Section titled “How did the variability compare?”| In a spreadsheet | In Tuva |
|---|---|
| The line graph the spreadsheet recommends plots each value but does not show a distribution, so students must infer range, centre and spread from the lines (spreadsheets can build histograms and, in Excel, box plots, but only with extra setup) | Drag Mean Daily Temperature (F) to the X axis · drag City to the Y axis · choose Dot or Box |
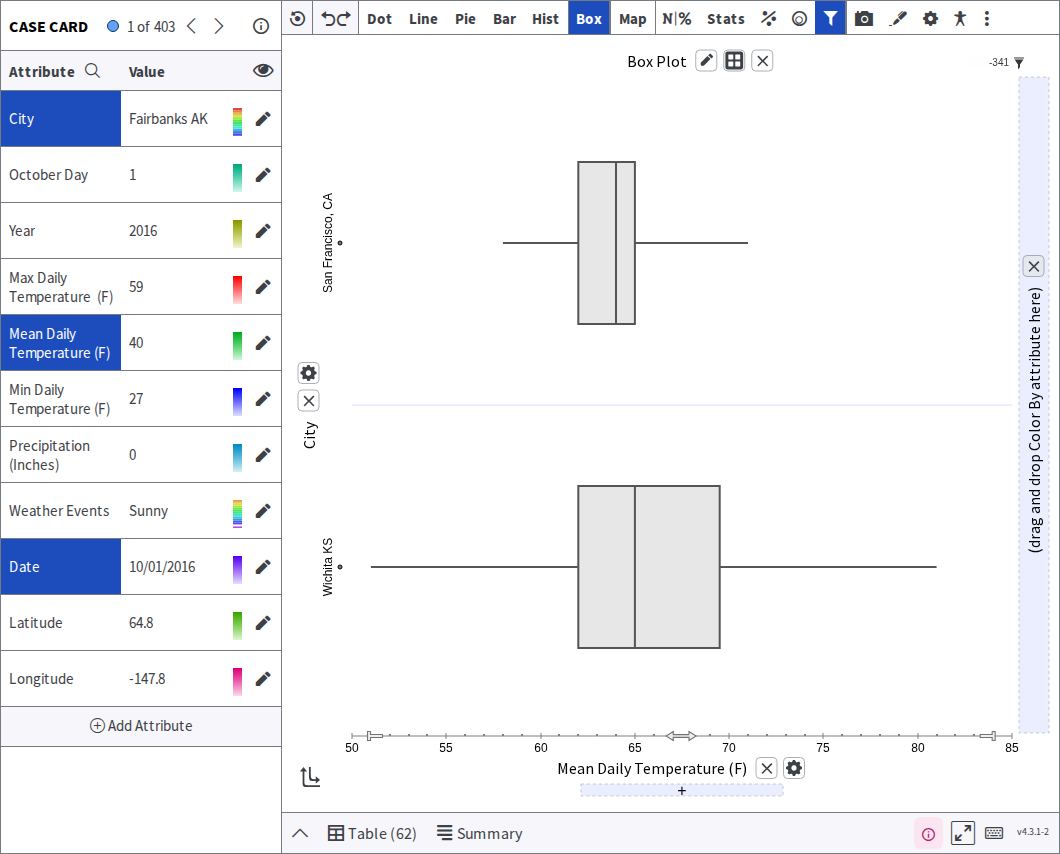
The third question is the one that matters: the chart the spreadsheet suggests draws the data but does not show its shape, so the comparison students most need to make is the one it does not support without extra work.
Was this page helpful?
This opens the ticket form with your comment and a link to this page, so we can reply to you.
Submit a ticket