
Ask Questions data stories: Students examine a provided dataset either as a table or in the Tuva interface and come up with one or a few questions that could be investigated with the given data. They describe a possible way to graph the data to investigate answers, or they evaluate a list of questions to identify which could (or could not) be investigated with the given data.
Goal: Students frame (or evaluate) questions according to the attributes, categories, and data ranges that are available in the dataset.
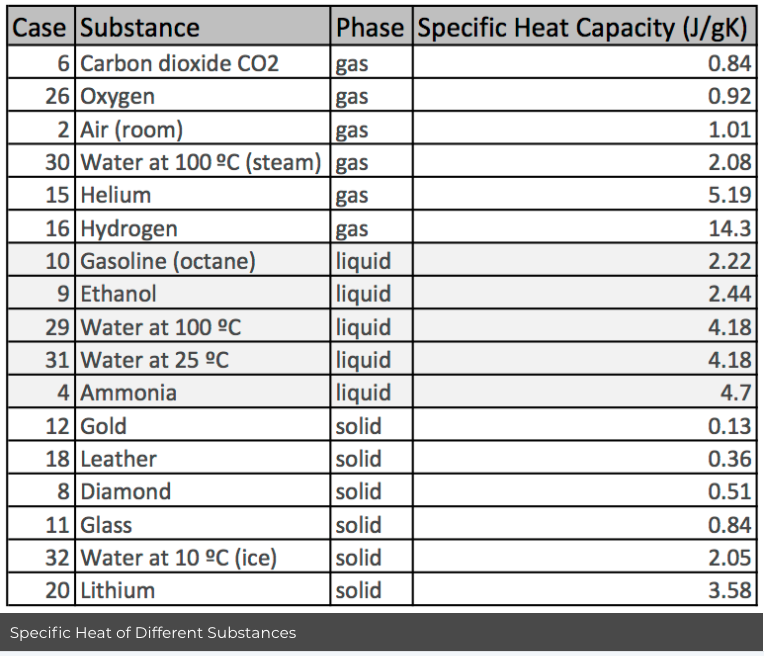
Example: Tuva Data Story Be Specific With your Heat Given a table of substances, phase of matter, and specific heat, students pose questions that the dataset could address.
|
Implementation ideas: Ask Questions data stories can be used to introduce a new topic and stimulate curiosity. They can also be used (along with the supporting resources below) to scaffold students in framing clear questions that can be investigated with a given dataset.
Related resources:
Tuva reference handout: Language for Asking Questions
Student worksheet: What Kind of Question, What Kind of Graph?
Graph Choice Chart: Graph Choice Chart
Was this page helpful?
This opens the ticket form with your comment and a link to this page, so we can reply to you.
Submit a ticket