
There will be instances where you will not see the curve appear in the graphing window. It is because its range is beyond the scale of the axes.
Here is an example:
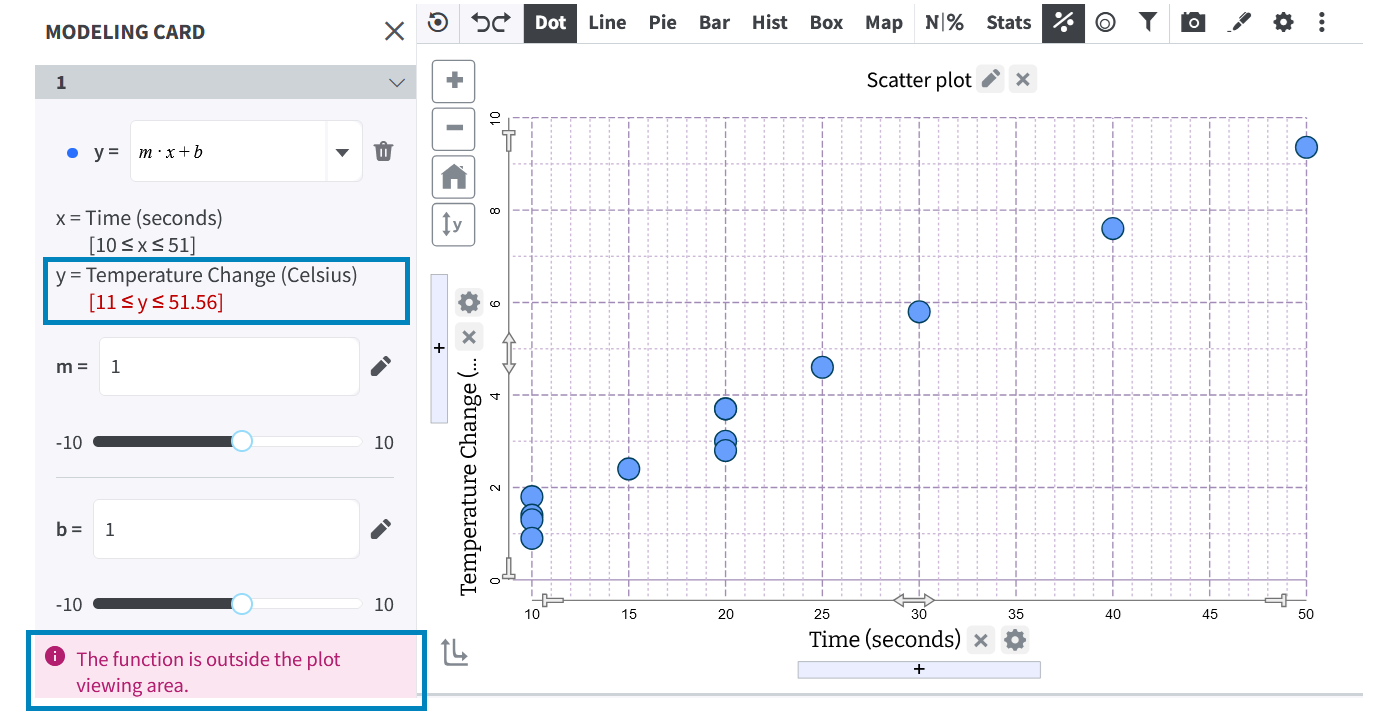 |
The linear function y = m_x_ + b is not visible in the graphing area.
When you cannot see the function, you can do the following to bring it into view:
Step 1:
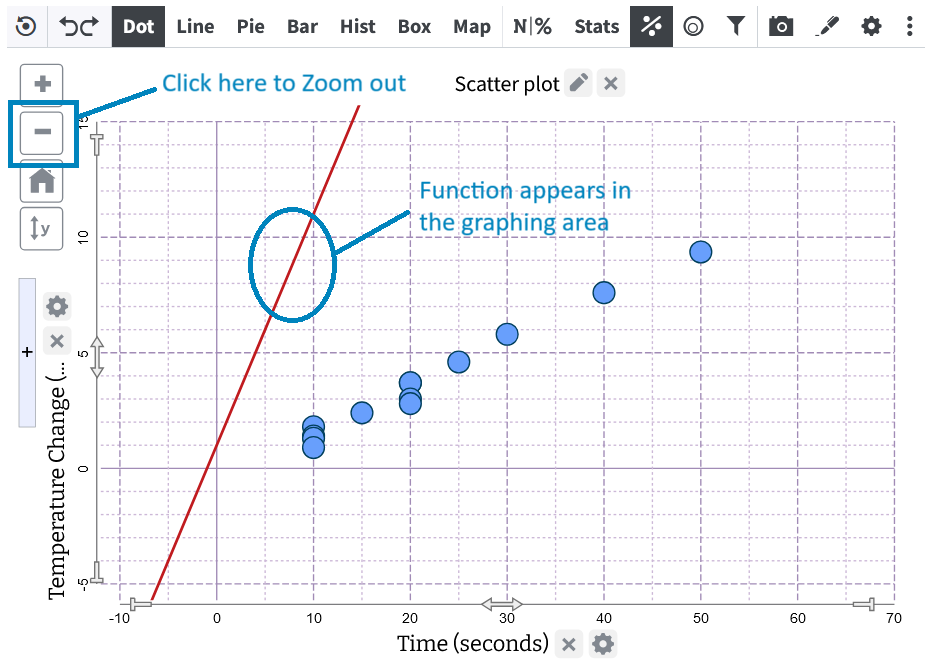
You will see several buttons on the top left in the graphing area.
Click on the  button to zoom out. You should be able to see the function now.
Note: There could be instances where you may have to click the button more than once.
 |
Step 2:
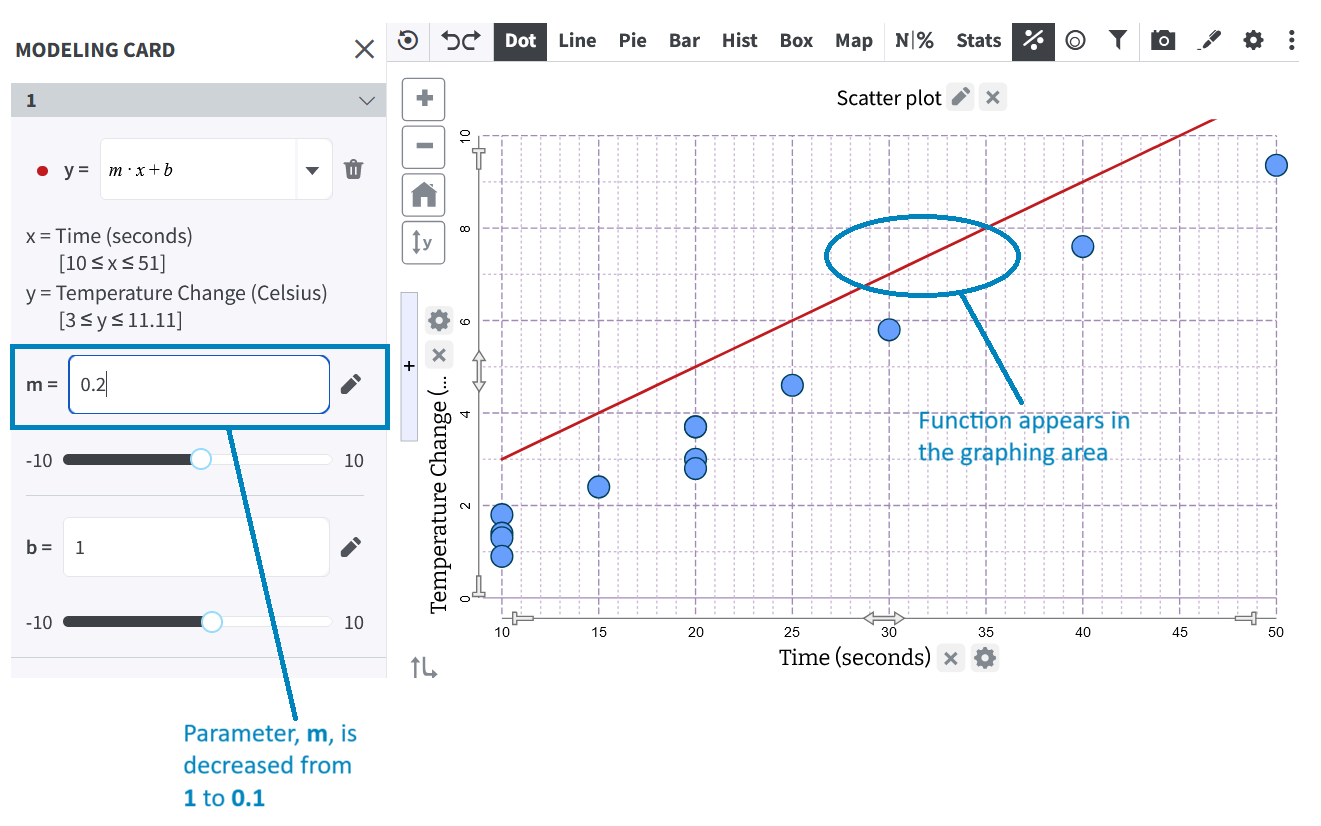
You can use the functions’s position to decide how to translate it and bring it closer to the actual data points.
In this case, we see that the slope of the linear function needs to be decreased.
Thus, decreasing the parameter m gets it in the viewing window.
 |
Step 3:
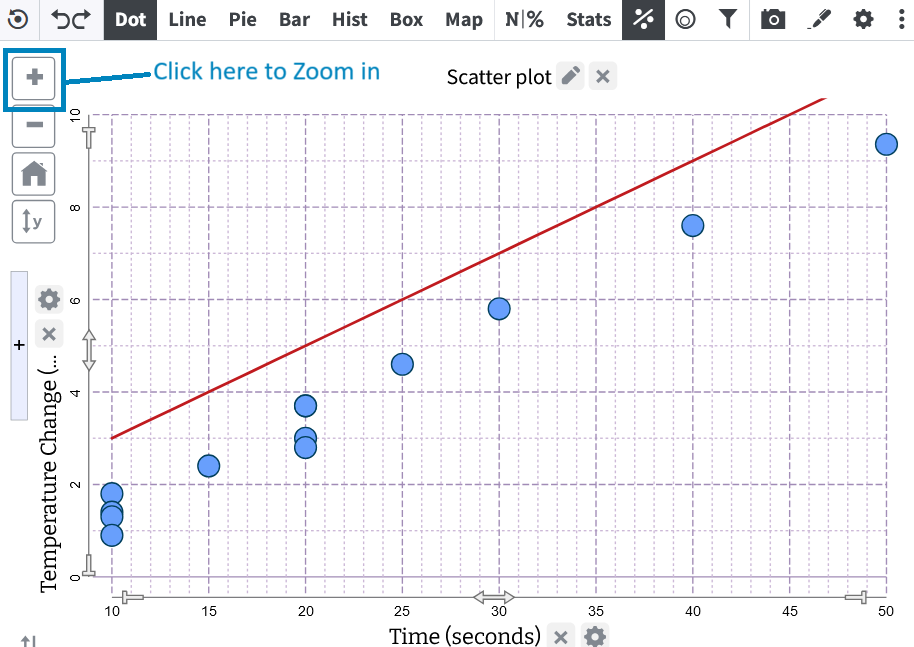
Once you have located the curve, click the  sign to revert to normal view.
 |
Step 4:
Continue tweaking the parameter values until you get the best fit.
For assistance with tweaking the parameter, please reference this article.
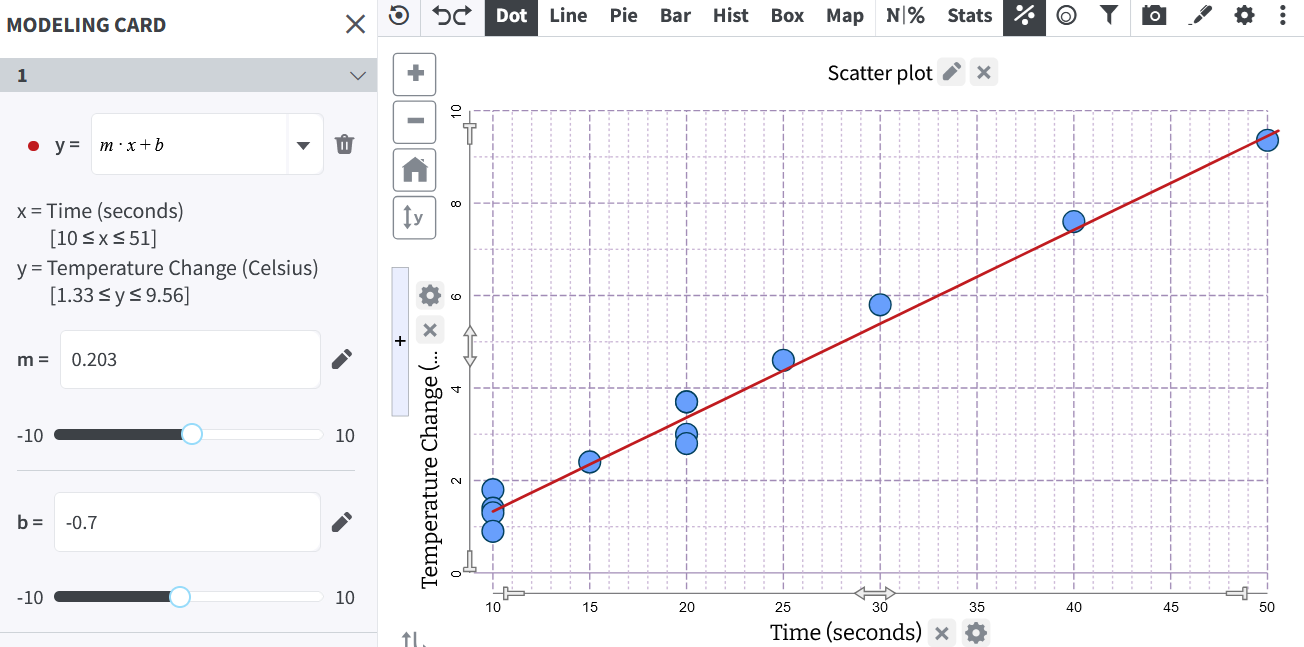 |
Once you are happy with the fit, you are all set to make sense of your function in the context of the data!
Was this page helpful?
This opens the ticket form with your comment and a link to this page, so we can reply to you.
Submit a ticket