Students can work with the Tuva movable line to begin eyeballing an estimation of a linear fit. Using the moveable line tool, students can easily stretch and drag a line to approximate data.
The process of creating a movable line to fit bivariate linear data is fairly simple.
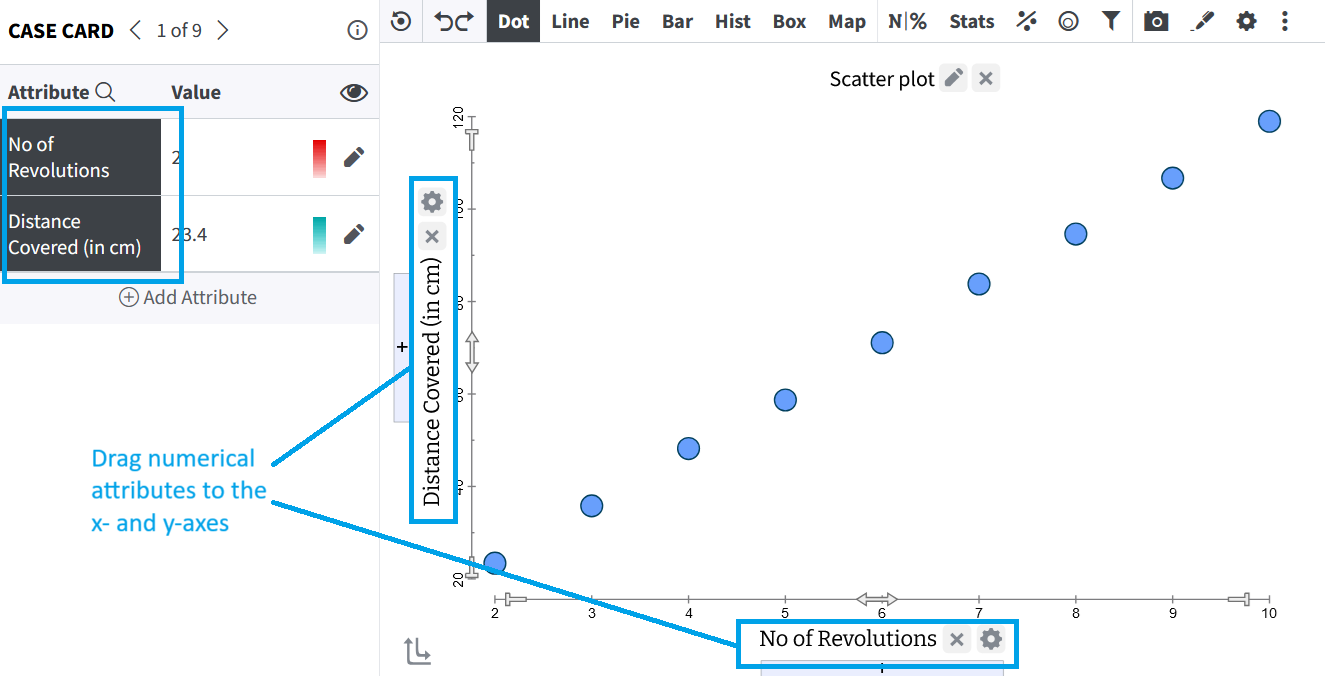
Step 1: Create a Scatterplot
Drag numerical attributes to each of the x- and y-axes.
 |
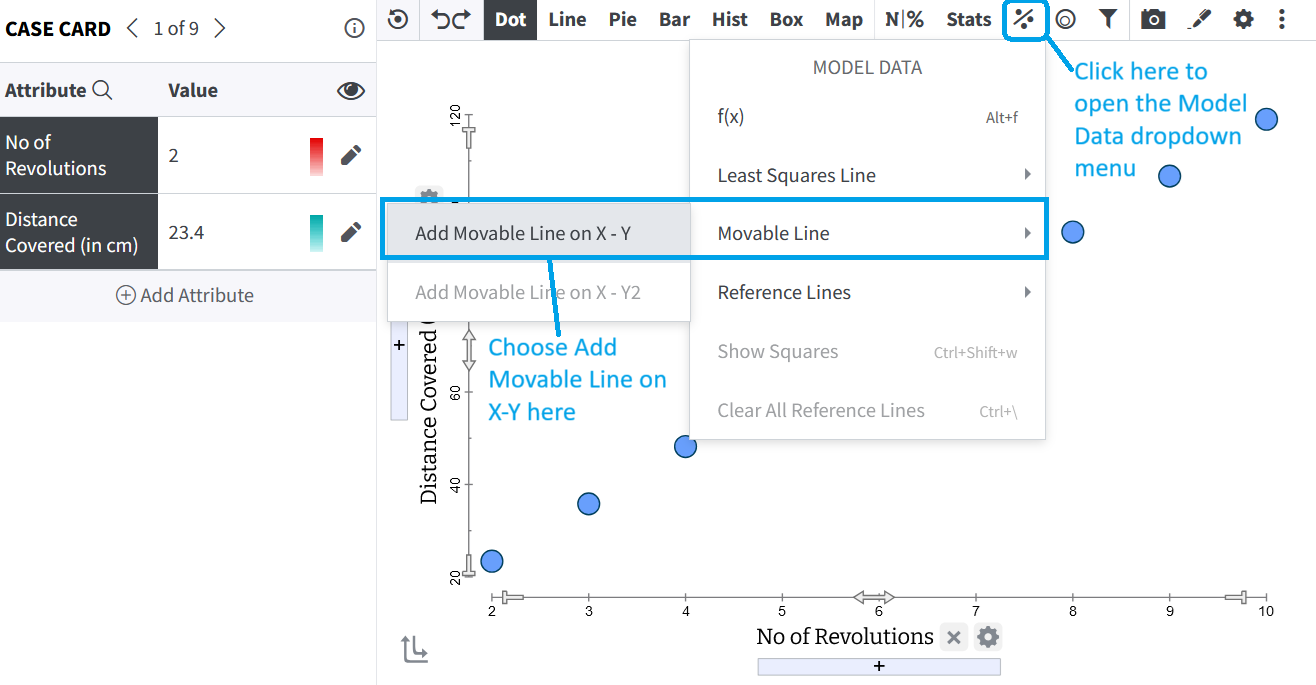
Step 2: Add the Moveable Line
Click on Model Data in the toolbar to open the dropdown menu.
From the dropdown, choose Movable Line — Add Movable Line on X-Y.
This will add an unfitted, movable line on the scatterplot.
 |
If you would like to change the color of the line, click on the small grid icon (Context menu) next to the X when the line is highlighted.
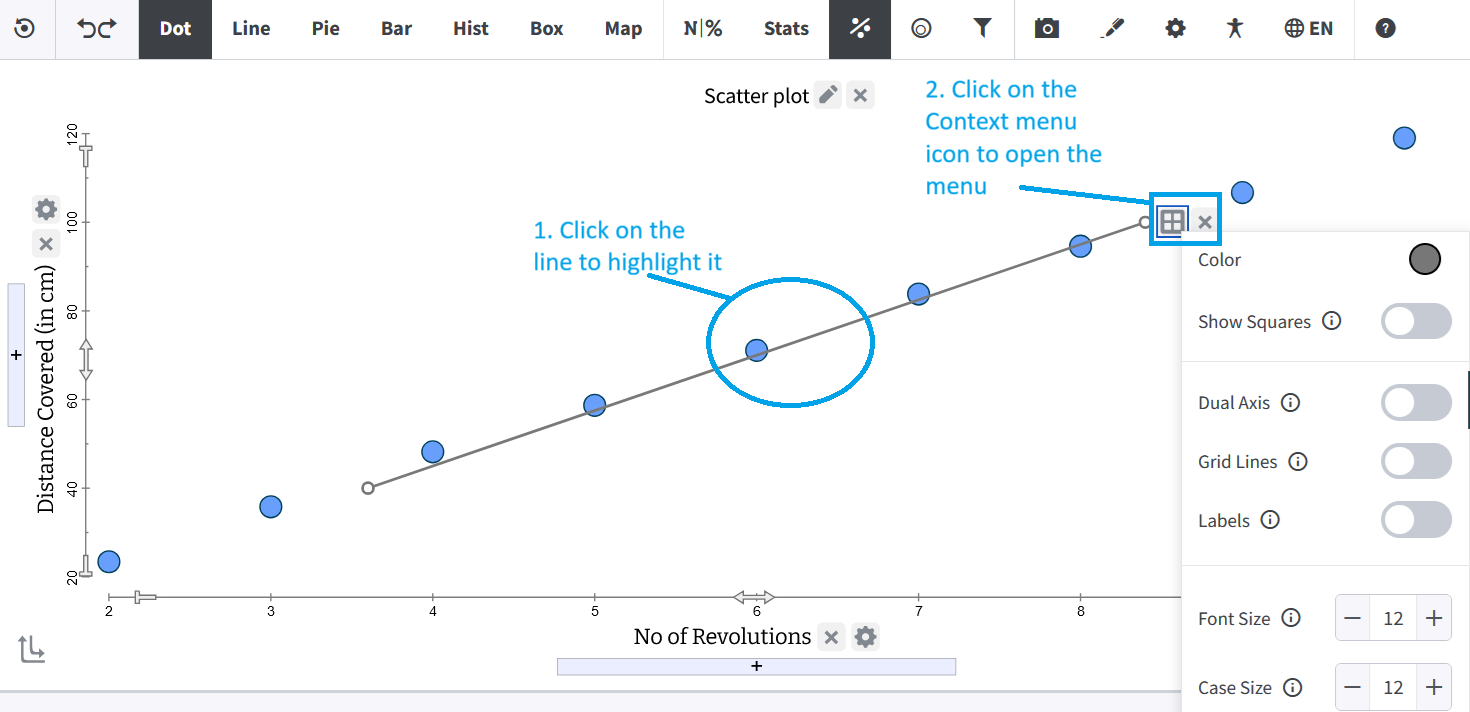 |
From the menu, click on the circle next to Color to open the color picker and select the color you like.
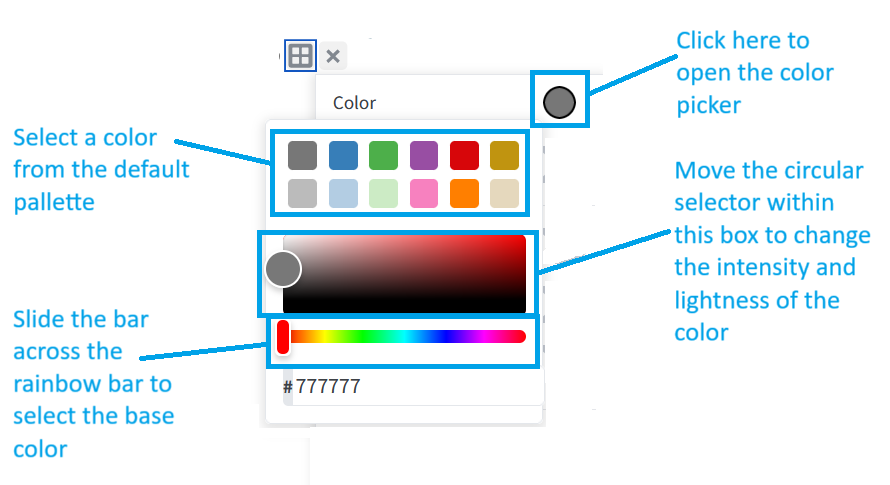 |
If you chose the default red, your graph will look something like this.
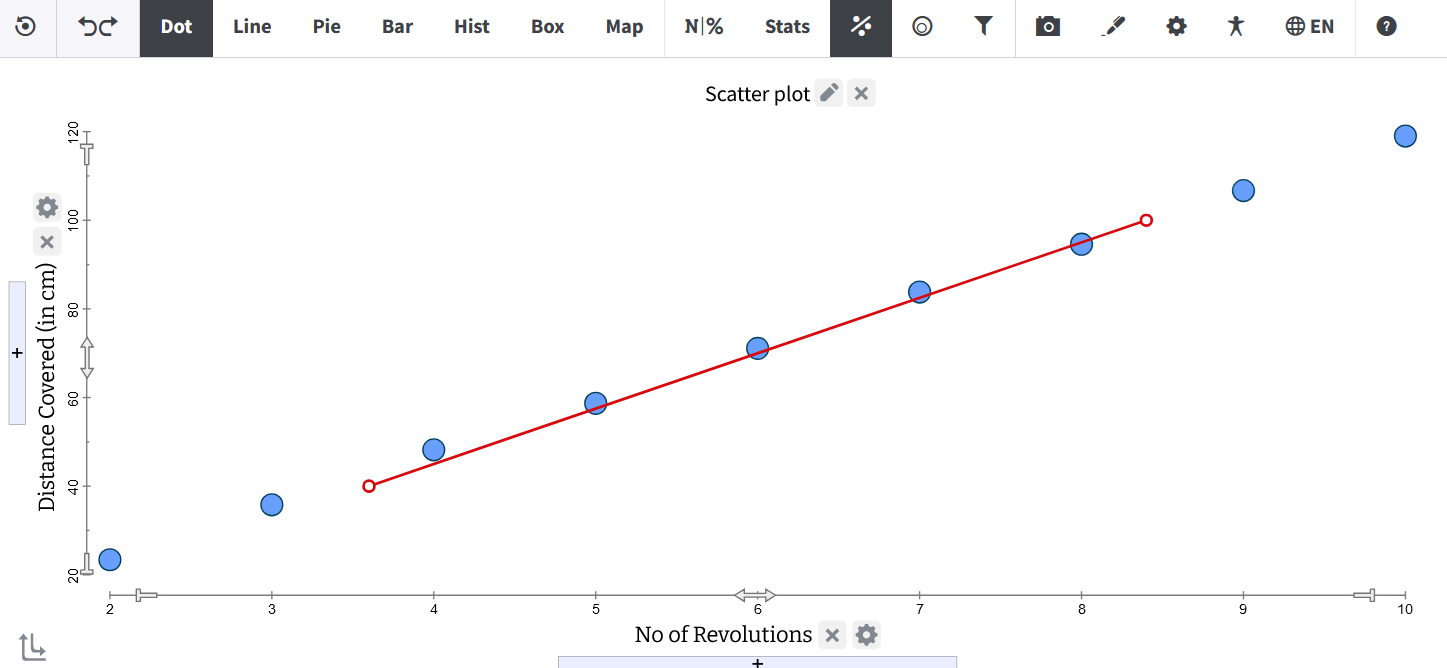 |
Step 3: Adjusting the Line
Drag the line by its middle to translate the line (shift up, down, left, or right). This changes the intercept.
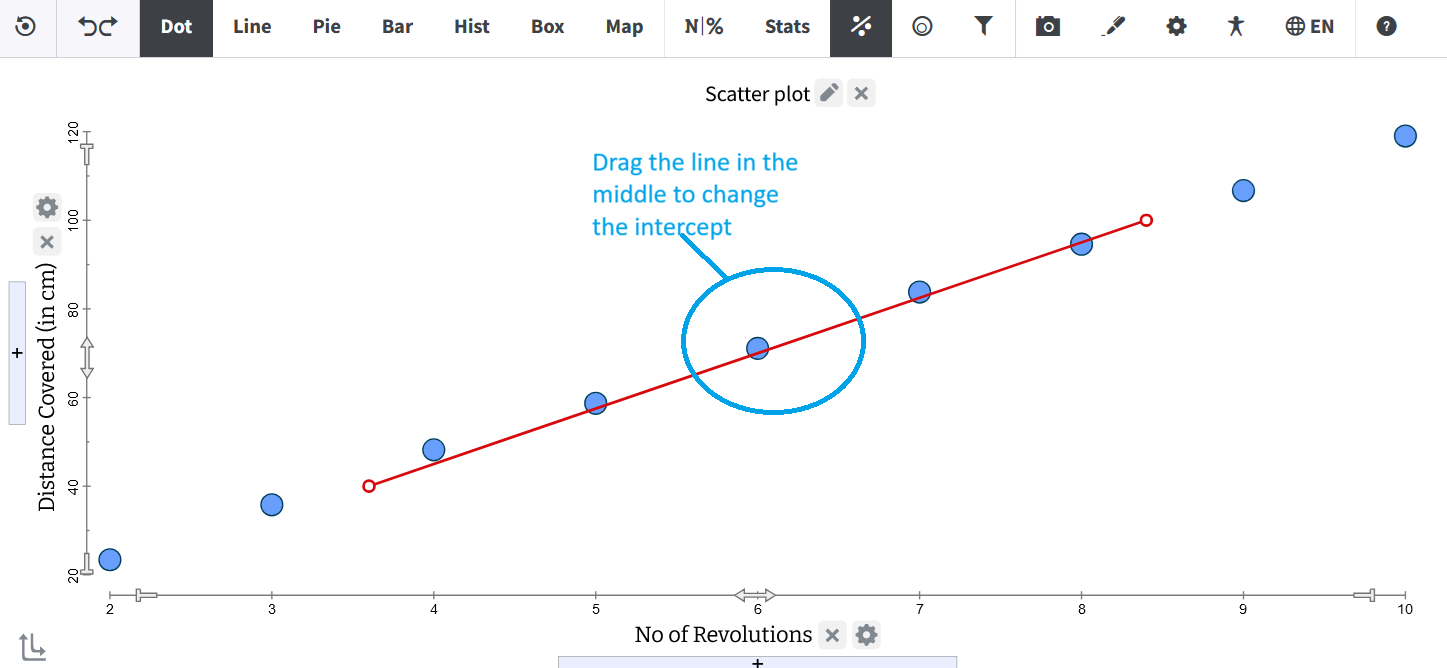 |
Drag by the handles at either end to rotate the line or change the slope.
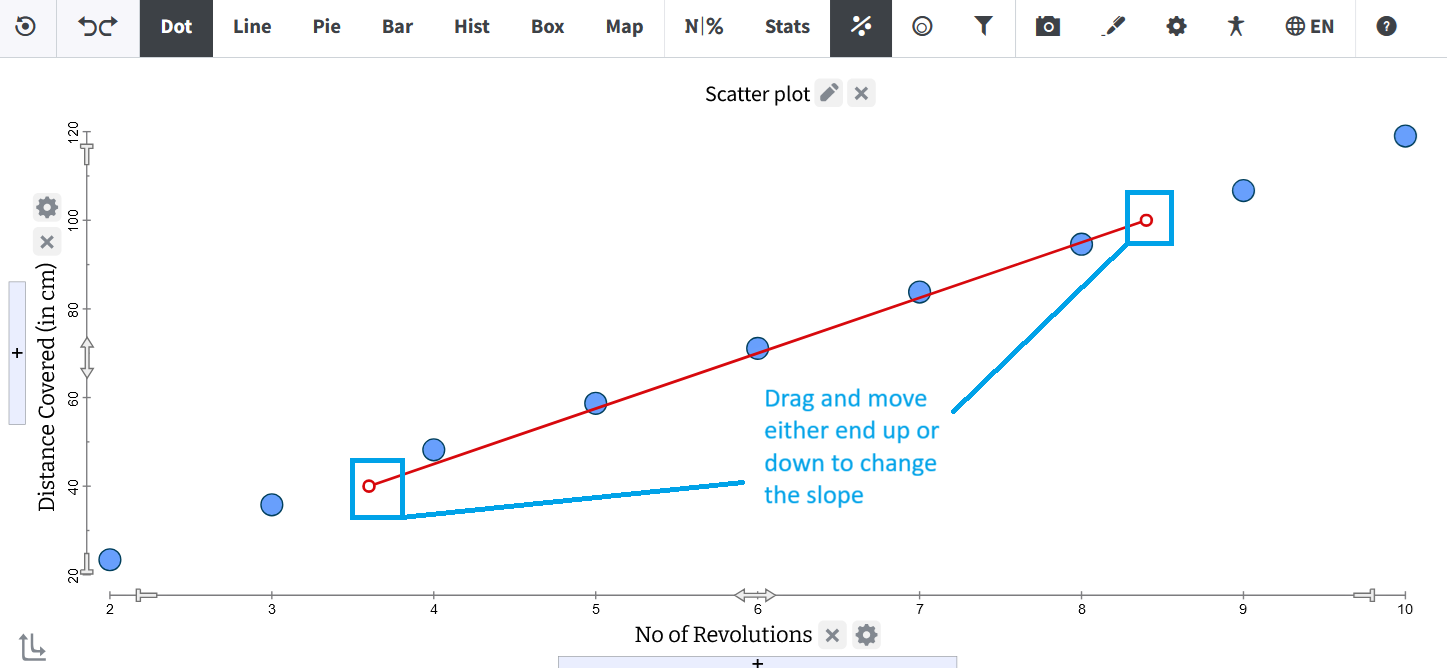 |
Drag either handle along the slope of the line to stretch the line.
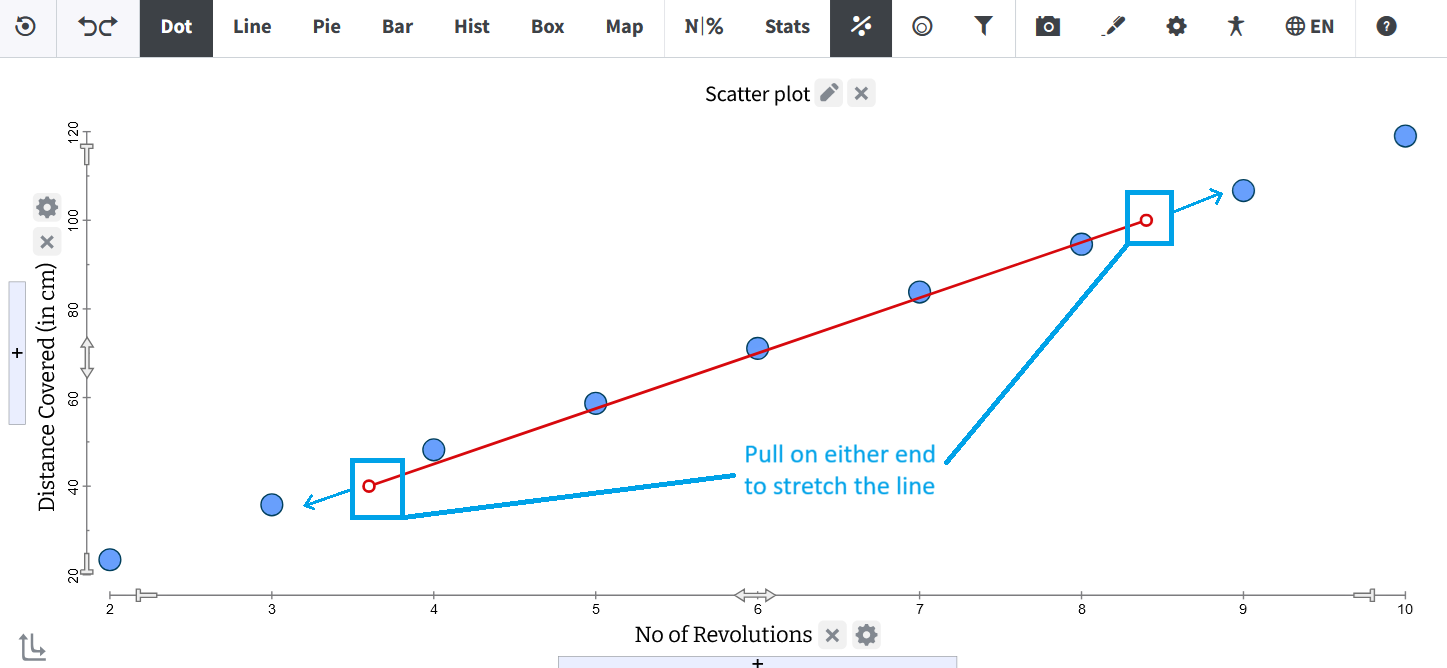 |
The parameters of the line get updated dynamically as you drag the movable line in search of a good fit.
Step 4: Finding the Right Fit
Continue to tweak the line until it seems to fit the data. The fitted graph will look somewhat like this:
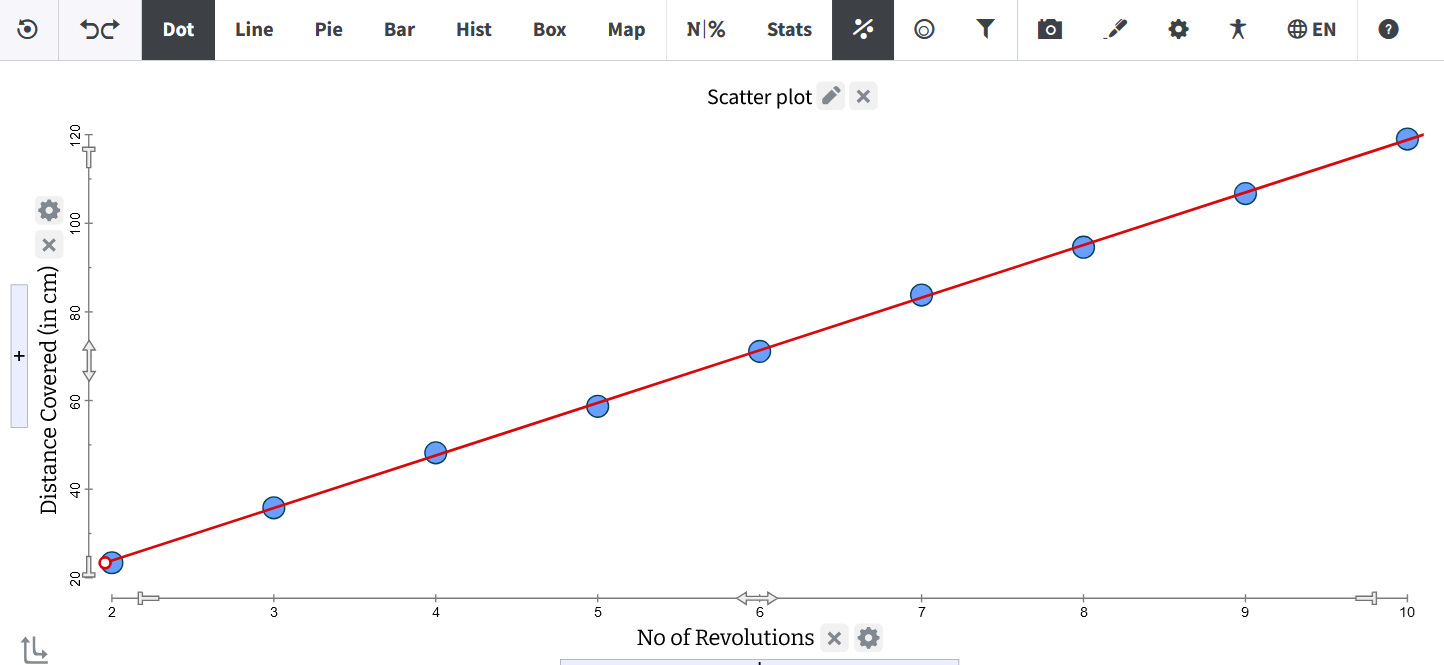 |
When you hover on the line, the equation of the line will appear, and you can start making sense of the equation and parameters in the context of your data.
Was this page helpful?
This opens the ticket form with your comment and a link to this page, so we can reply to you.
Submit a ticket